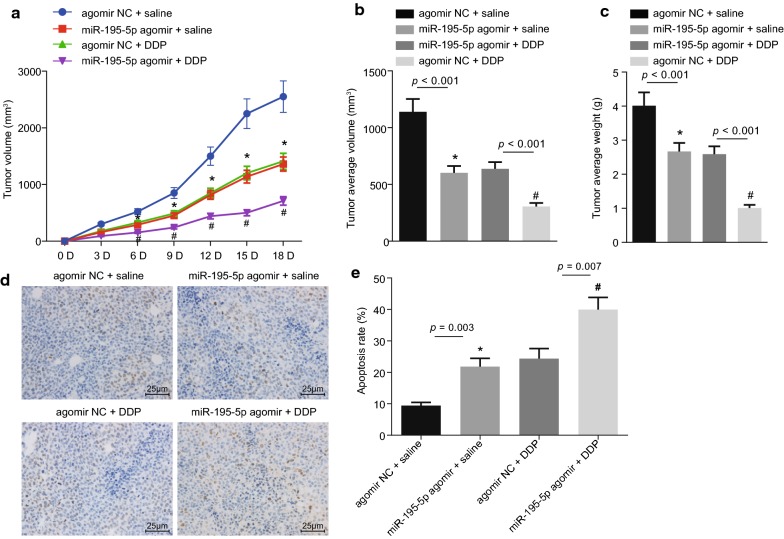
Fig. 7.
Over-expression of miR-195-5p inhibits chemotherapy resistance in vivo. a The growth curve of xenograft tumors in nude mice; b final volume of xenograft tumors; *p < 0.05 vs. the agomir NC + saline group; #p < 0.05 vs. the agomir NC + DDP group; c final weight of xenograft tumors; *p < 0.05 vs. the agomir NC + saline group; #p < 0.05 vs. the agomir NC + DDP group; d cell apoptosis of nude mice in xenograft tumors detected by TUNEL staining (×400, scale bar = 25 μm); positive cells are stained as brown-yellow in the nuclei; e quantitative apoptosis rate in xenograft tumors of nude mice; *p < 0.05 vs. the agomir NC + saline group; #p < 0.05 vs. the agomir NC + DDP group, n = 8 in each group. The figure data are measurement data and expressed as mean ± standard deviation; one-way ANOVA is used among multiple groups and repeated ANOVA is applied at different time points; the experiment was independently repeated three times

