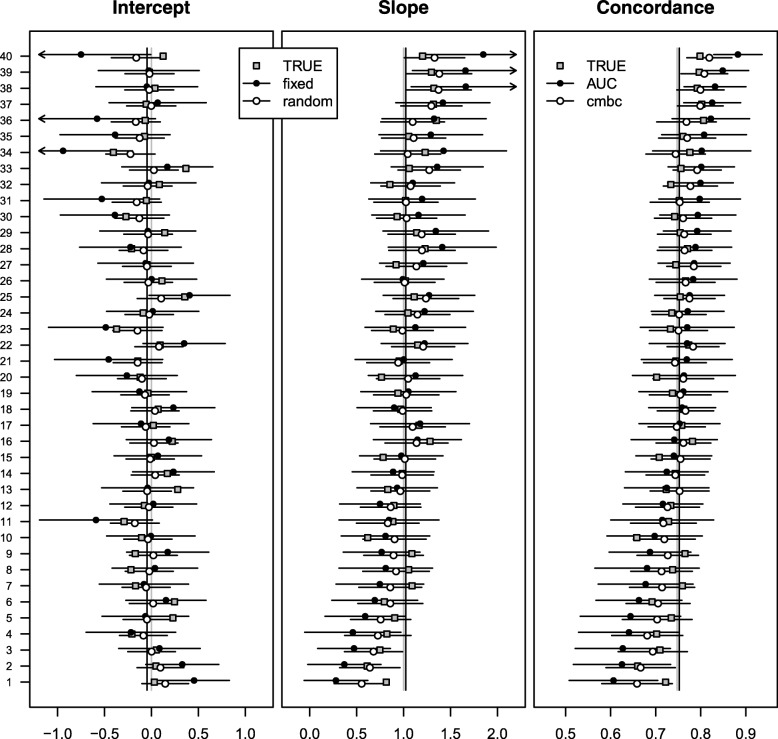
Fig. 3.
Performance measures across 40 centers of 200 simulated patients. Gray squares represent true values of intercept, slope, and concordance probability. Closed dots represent fixed effect intercept estimates; fixed effect slope estimates; and c-indexes in the first, second, and third panel, respectively. Open dots represent random effects intercept estimates; random effects slope estimates; and calibrated model-based concordance estimates in the first, second, and third panel, respectively. Gray vertical lines represent effect estimates of intercept and slope in the original regression model, together with the expected pooled concordance. Black vertical lines represent fixed effect estimates of intercept and slope in a multilevel regression model, together with the expected pooled concordance

