Fig. 3.

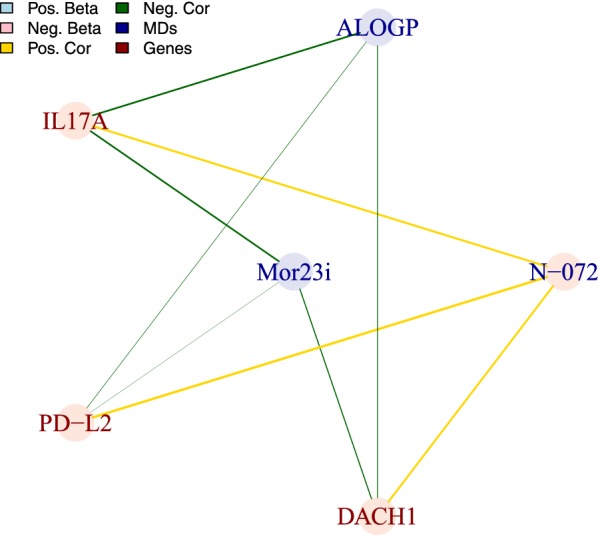
Correlation graph of the six MDs/MOA features of the QSMARt model. Vertex color represent the sign of the associated beta value while edge colors show the sign of the correlation of the features across the X dataset

Correlation graph of the six MDs/MOA features of the QSMARt model. Vertex color represent the sign of the associated beta value while edge colors show the sign of the correlation of the features across the X dataset