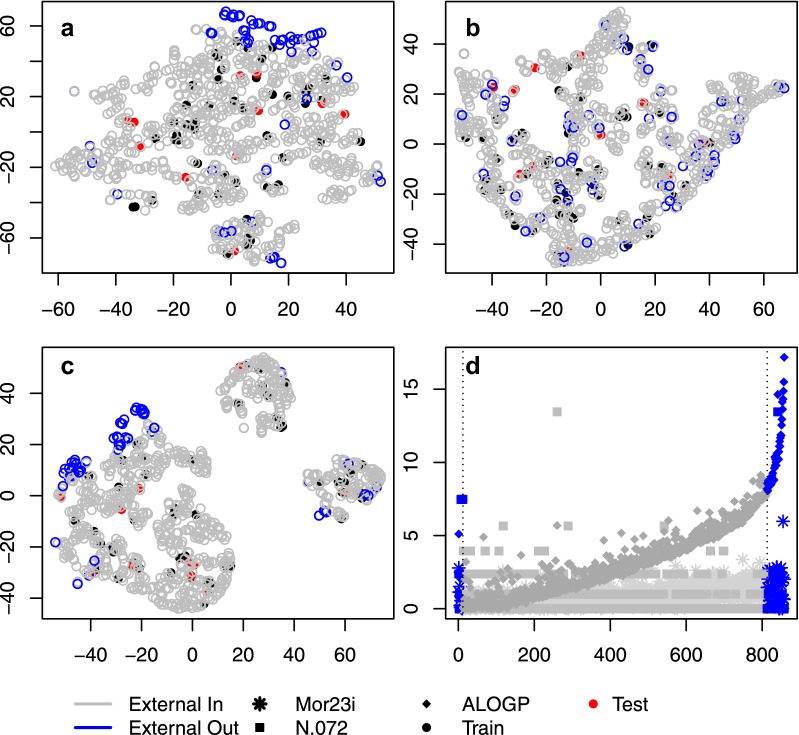
Fig. 5.
TSNE projection of the drugs in the albumin and external dataset. The projection was performed by using the set of genes and MDs (a), only the genes (b) and only the MDs (c) in the optimal hybrid model. The outliers are in the border area of the dataset for the molecular descriptors (c), while they are similar to the rest of the external set fort the gene log-fold change (b). Likewise, the outliers still appear on the border for the combined two sets of features (a). In panel (d) the values of the three MDs is plotted (y axis) for the drugs in the albumin and external dataset (x axis). The drugs are ordered based on their predicted value. Drugs from the external set that falls in the model prediction range are marked in gray, while the ones that are outside the range are marked in blue. Drugs in the training set are marked in black while drugs in the test set are marked in red

