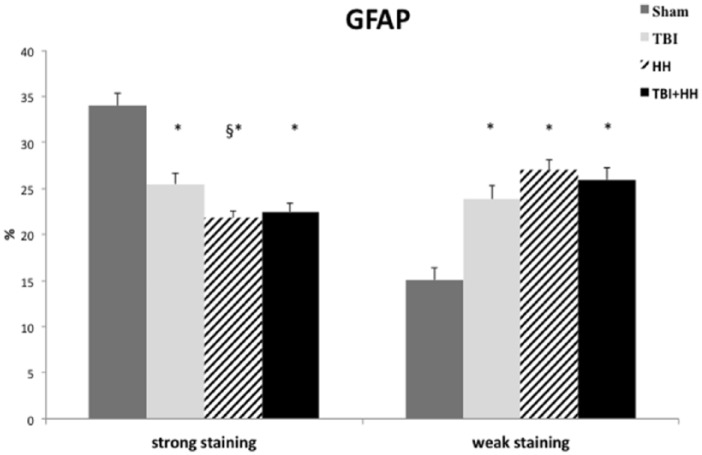
Figure 3.
Ratio of strong positive pixels (strong staining) on total pixels and weak positive pixels (weak staining) on total pixels for GFAP.
Data are expressed in mean ± SEM. We can note a significant decrease in percentage of strong staining and increase in percentage of weak staining for the TBI, HH, and TBI+HH groups compared with Sham group. GFAP indicates glial fibrillary acidic protein; HH, hypoxia-hypotension; SEM, standard error of the mean; TBI, traumatic brain injury.

