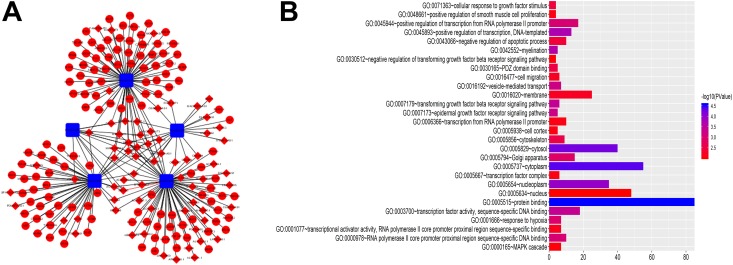
Figure 4.
The ceRNA network of down-regulated miRNAs and GO analysis. (A) In the network blue circles = upregulated mRNAs. Red quadrates = down-regulated miRNAs, and blue diamonds = up-regulated lncRNAs. (B) GO results for the target mRNAs of the down-regulated miRNAs ceRNA network. The bar plot indicates the enrichment scores of the significant GO terms (P value <.01, gene count ≥3).

