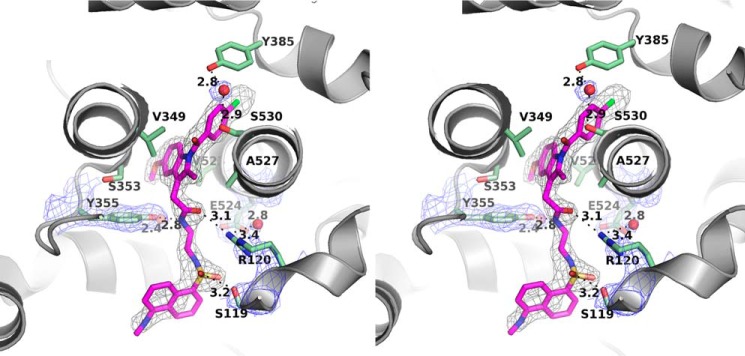
Figure 3.
Stereoview of the molecular interaction between compound 1 and COX-2. Compound 1 is colored magenta, and interacting residues of COX-2 are illustrated as green sticks. Structured water molecules are shown as red spheres. A simulated annealing composite omit map (38) around compound 1 is contoured at 3 σ in black wires. The 2Fo − Fc map around Arg-120, Glu-524, Tyr-355, and highly ordered waters is contoured at 1.5 σ in blue wires.

