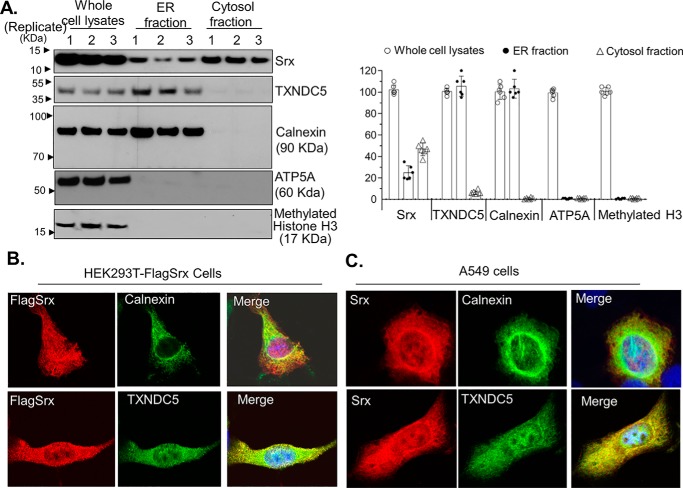
Figure 3.
Colocalization of Srx and TXNDC5 in the ER. A, subcellular fractionation and Western blotting indicate the presence of Srx and TXNDC5 in the ER. The numbers above the bands indicate independent, experimental repeats. The bar graph with a dot plot on the right indicates the quantitative results. B, immunofluorescence staining of overexpressed FLAG-Srx (red) in HEK293T cells and its colocalization with endogenous TXNDC5 (green) in the ER. The appearance of yellow in the merged image indicates possible colocalization. C, immunofluorescence staining of endogenous Srx (red) in A549 cells and its colocalization with endogenous TXNDC5 (green) in the ER. In these results, endogenously expressed calnexin, an ER-resident protein, is used as a specific marker that is only present in the ER. Error bars, S.D.

