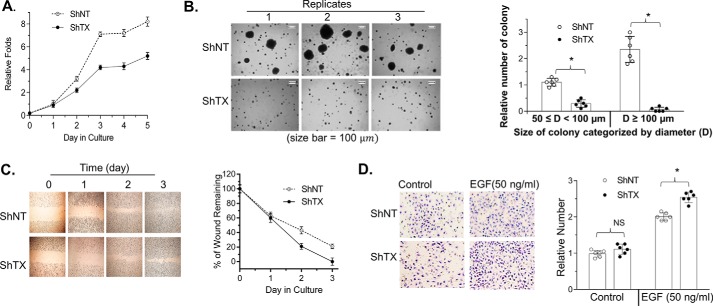
Figure 8.
Knockdown of TXNDC5 in A549 cells inhibits cell proliferation but promotes cell invasion. A, representative results of cell proliferation evaluated by the modified XTT assay. B, anchorage-independent colony formation in soft agar. C and D, wound-healing assay as shown in culture (C) and quantitation (D). E and F, Matrigel invasion assay showing invaded cells (C) and quantitation (D). The bar graph with a dot plot indicates the quantitative results (*, p < 0.05; NS, no significance; one-way ANOVA). Error bars, S.D.

