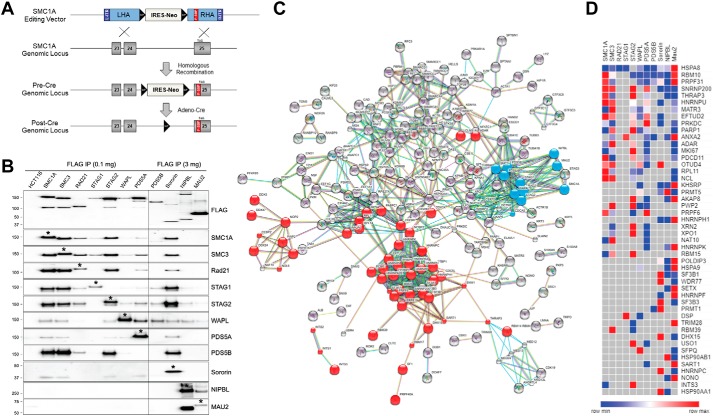
Figure 1.
Endogenous epitope tagging and generation of the cohesin interactome. A, SMC1A epitope-tagging vector was designed to modify the final coding exon (exon 25), adding a 1× FLAG-SBP (F-SBP) dual epitope tag immediately prior to the natural stop codon (TAG). Subsequent Cre-mediated recombination removed the FLOXed IRES-NeoR gene, leaving behind a single LoxP site in intron 24 and F-SBP in exon 25. See Fig. S1 for schematics and details of epitope-tagging vectors for the other 10 components of cohesin. B, nuclear extracts from parental HCT116 cells and cohesin epitope-tagged derivatives were immunoprecipitated (IP) with FLAG-M2 beads followed by peptide elution. Western blotting was performed with FLAG antibodies to measure the relative abundance of the tagged cohesin subunits and with antibodies to each of the other components of cohesin to measure their relative efficiency of co-purification. Asterisks denote the epitope-tagged protein, which is slightly larger than the untagged protein. Because PDS5B, sororin, NIPBL, and MAU2 are much less abundant than the other components of cohesin, more protein was used for immunoprecipitations in cells with epitope-tagged alleles of these genes as indicated. C, mass spectrometry data were analyzed using STRING software for the identification of functional protein interaction networks. Nodes represent proteins identified by MS from dual-affinity purifications of endogenous epitope-tagged cells. Blue nodes represent each of the 11 cohesin subunits used as baits. Red nodes represent interacting splicing factors and proteins with RNA-binding domains as identified by GO, KEGG, and Pfam analysis. Edges represent protein–protein interactions, with teal and pink representing known interactions from curated databases and experimentally determined, respectively; green, red, and blue represent predicted interactions via gene neighborhoods, gene fusions, and gene co-occurrences, respectively; and light green, black, and violet represent interactions predicted by text mining, co-expression, and protein homology analysis, respectively. D, heatmap of interactions between cohesin subunits (columns) and interacting splicing factors/RNA-binding proteins (rows). Proteins identified in two or more affinity purifications are shown. Colors as shown on the key represent the relative abundance of each protein (as measured by ion area) in each of the 11 affinity purifications.

