Figure 4.
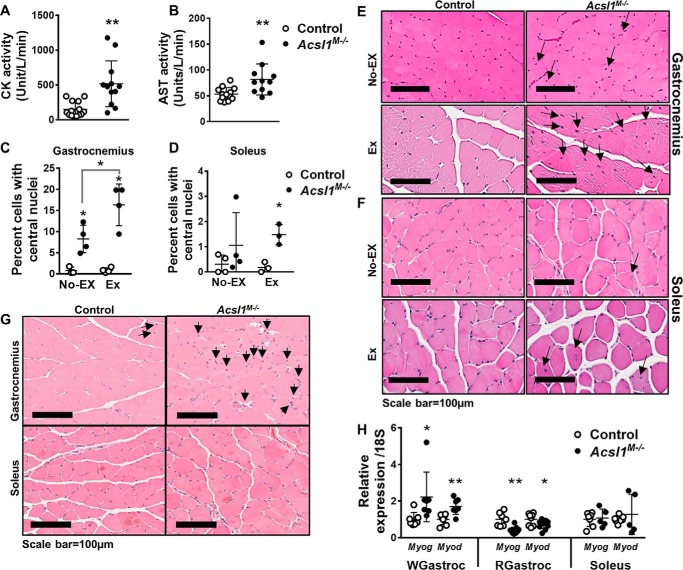
Myopathic features of Acsl1M−/− mice. Plasma creatine kinase (CK) (A) and aspartate transaminase (AST) (B) activities after food deprival for 4 h, n = 11–14 per genotype. C and D, approximately 2000 cells (total) from four randomly selected areas in two adjacent gastrocnemius sections and all cells from an entire soleus section were counted. Shown is the percentage of cells containing central nuclei in gastrocnemius and soleus from nonexercised (No Ex) and exercised (Ex) mice after 2 weeks of voluntary running, n = 3–4 per genotype. E and F, representative 100-μm images of hematoxylin and eosin–stained gastrocnemius and soleus. Arrows, central nuclei. G, tissue was fixed in 10% formalin. Representative 100-μm images of the immunostained mitosis marker, phosphohistone H3, in nonexercised gastrocnemius and soleus. H, mRNA expression of muscle regeneration markers Myog and Myod in white gastrocnemius (WGastroc), red gastrocnemius (RGastroc), and soleus. Data were normalized to 18S mRNA, n = 5–7 per genotype. Data are presented as means ± S.D. (error bars); **, p < 0.01; *, p < 0.05.

