. 2019 May 10;10(21):5452–5460. doi: 10.1039/c9sc01321k

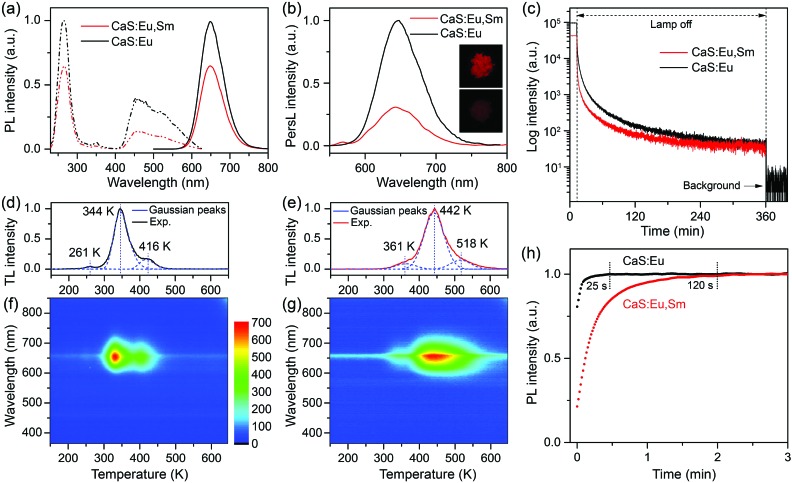
Fig. 3. (a) PL excitation spectra (dash-dotted line, λem = 650 nm) and PL emission spectra (solid line, λex = 470 nm) of the annealed CaS:0.06%Eu2+ and CaS:0.06%Eu2+, 0.006%Sm3+ NCs. (b) PersL emission spectra and (c) PersL decay curves (λem = 650 nm) of the NCs after illumination with a white LED for 5 min. The insets in (b) show the PersL photographs of (top) CaS:0.06%Eu2+ and (below) CaS:0.06%Eu2+, 0.006%Sm3+ NCs recorded at 1 min after the cease of excitation. TL glow curves and the corresponding wavelength-temperature contour plots of (d and f) CaS:0.06%Eu2+ and (e and g) CaS:0.06%Eu2+, 0.006%Sm3+ NCs. (h) PL rise curves (λex = 470 nm, λem = 650 nm) of CaS:0.06%Eu2+ and CaS:0.06%Eu2+, 0.006%Sm3+ NCs after emptying the traps by heating the samples at 350 °C for 10 min.

Fig. 3