. 2019 May 10;10(21):5452–5460. doi: 10.1039/c9sc01321k

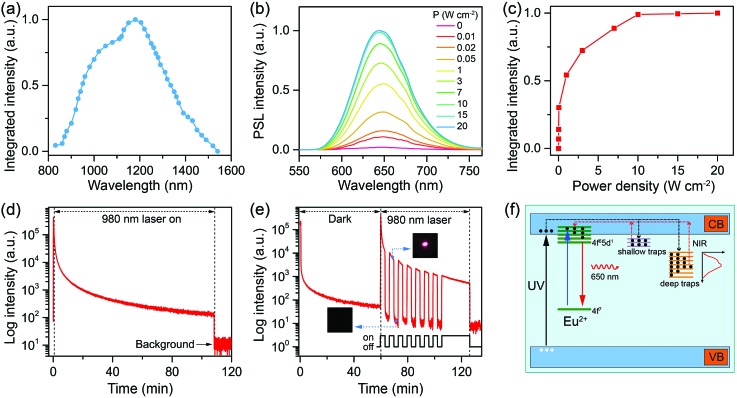
Fig. 4. (a) PSL stimulation spectrum of the annealed CaS:0.06%Eu2+, 0.006%Sm3+ NCs by monitoring the Eu2+ emission at 650 nm. (b) PSL emission spectra and (c) integrated PSL intensities of the charged CaS:0.06%Eu2+, 0.006%Sm3+ NCs upon irradiation with a 980 nm diode laser at different power densities. (d) PSL decay curve (λem = 650 nm) of the charged CaS:0.06%Eu2+, 0.006%Sm3+ NCs under continuous laser irradiation at 980 nm with a power density of 10 W cm–2. (e) PSL decay curve (λem = 650 nm) of the charged CaS:0.06%Eu2+, 0.006%Sm3+ NCs under periodical laser irradiation at 980 nm with a power density of 10 W cm–2 after the NCs underwent 60 min of afterglow decay. The insets show the photographs of the NCs when the laser was on and off, respectively. (f) Schematic illustration of the PSL mechanism in CaS:Eu2+,Sm3+ NCs. The solid-line arrows denote electronic transitions, and the dashed-line arrows represent the trapping (black) and de-trapping (red) of electrons.

Fig. 4