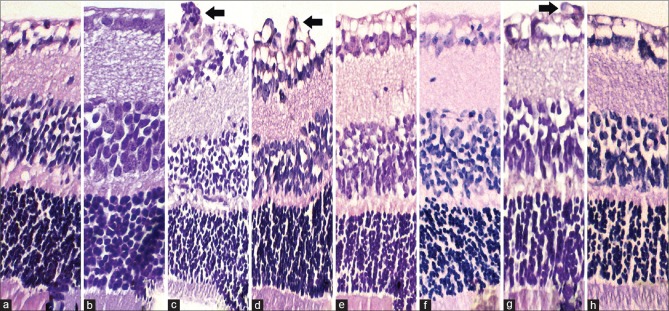
Figure 2.
Light micrographs of C57BL/6J mouse retina. Serial sections of the retina (4 μm thick), starting from the optic disc with the second sections after the optic disc taken for evaluation. The arrows in slides c, d, and g indicate endothelial cell proliferation, which are respectively the OIR nontreatment group, OIR DMSO-injected group and the low dose IPC group. Slides a and b have no proliferation, whereas slides e,f and h have significantly less compared with c,d and g. Original magnification ×20

