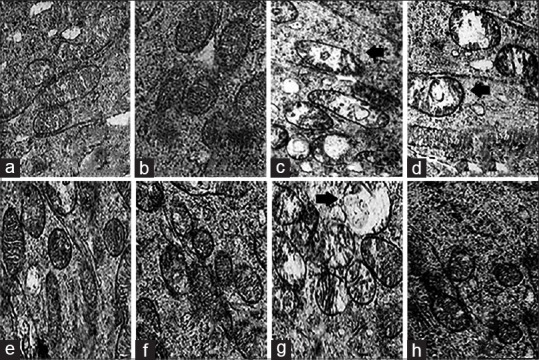
Figure 3.

Electron micrograph showing mitochondrial morphology. Arrows in slides c, d, and g indicate atypical mitochondria with mottled matrix and electron-dense bodies in the cristae central region surrounded by lytic matrix and extensive cristalysis. Note their increase in slide g (low dose IPC group). Slide a and b have none, whereas slides e,f and h have significantly less compared with c,d and g
