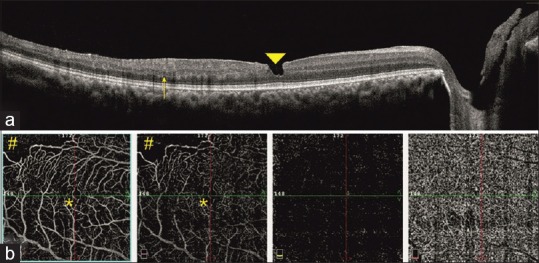
Figure 3.

OCT at presentation shows the ERM, inner layer loss at the macula (arrowhead). In addition, it demonstrates the loss of retinal architecture temporal to the fovea (arrow) with retinal thinning (a). OCTA shows the superotemporal flow voids in the region of retinal ischemia (hashtag) with a small FAZ in the superficial and deep capillary plexus (asterisk) (b)
