
Figure 2. Manhattan plot displaying top CpG sites associated with exposure to adversity.
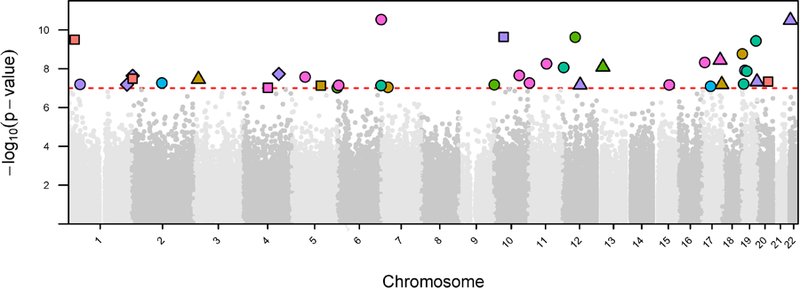
In this Manhattan plot, the x-axis is the chromosomal position for each CpG site and the y-axis is the -log10 p-value for the association between exposure to adversity and DNAm values at each CpG site. The dashed line shows the epigenome-wide significance level, with each CpG site above the line representing a statistically significant association (p<1×10⁻⁷). The color of each CpG site refers to the type of adversity. The shape of each CpG site indicates the lifecourse model tested. The sensitive period hypotheses were encoded as circle: very early childhood, triangle: early childhood, square: middle childhood. The recency hypothesis was encoded as a diamond. As shown, CpG sites significantly affected by exposure adversity were distributed throughout the genome. There was no obvious genomic spatial pattern by adversity type or timing of exposure.