
Figure 4. Scatterplot displaying increased power in the SLCMA shown by the comparison of beta estimates from the EWAS vs. SLCMA approaches.
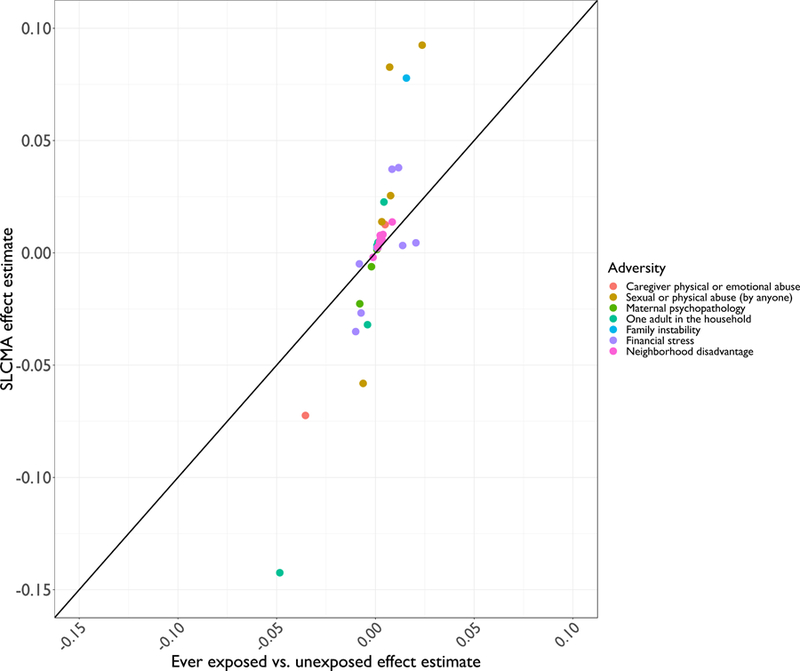
In this scatterplot, the y-axis represents the beta estimates associated with the 38 top CpG sites derived for the SLCMA; the x-axis represents the beta estimates associated with the same 38 CpG sites obtained from EWAS. Different types of adversity are indicated by colors. The black straight line denotes the 1:1 correspondence between the two sets of beta values. Substantial positive deviation from the line suggests increased power in the SLCMA. For most CpG sites, the magnitudes of effect were larger for the SLCMA compared to the EWAS results.