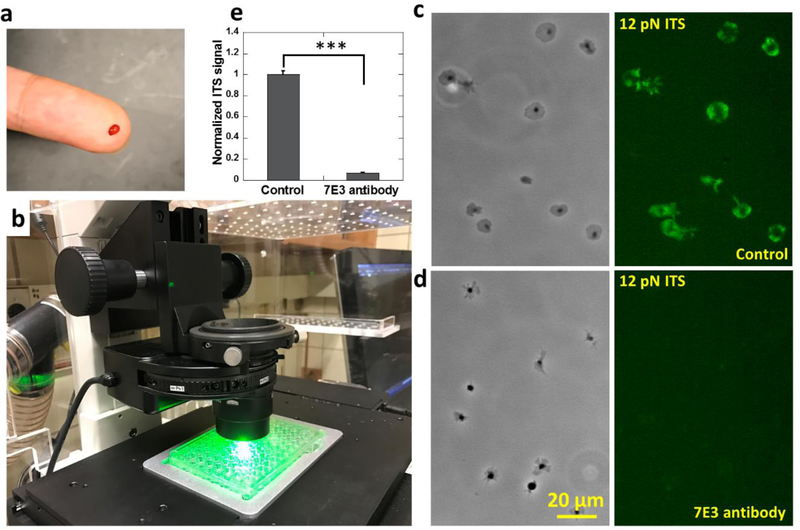
Fig. 2. Platelet force mapping with human blood obtained by finger prick method.
a, 10 μL blood collected by finger prick method. b, Platelet force mapping conducted in a 12 pN ITS coated 96-well plate. Integrin tensions higher than 12 pN were fluorescently recorded on the surface. c-d, Platelet morphology and force map of platelets in a control group (c) and platelets treated with 100 μg/ml 7E3 antibody which blocks integrin αIIbβ3 (d). e, ITS signal intensity of platelets in the control group and the 7E3 antibody-treated group. Error bar represents standard error. (48 platelets for each data points) The two-tailed P value is less than 0.001 between ITS signals of platelets in control group and in 7E3 antibody treated group.

