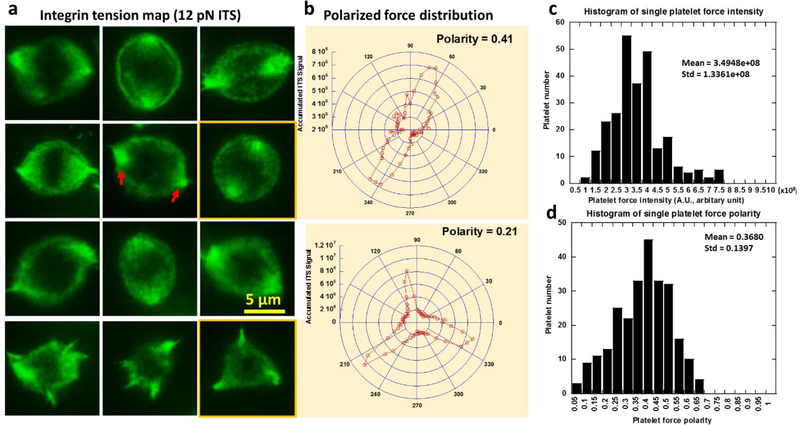
Fig. 3. Polarization and intensity of platelet forces contributed by integrin tensions higher than 12 pN.
a, force distribution as measured with the ITS in platelets is inhomogeneous and polarized. Cellular forces transmitted by integrins in platelets are distributed in a ring pattern, with two or three force foci in which the force signal is more concentrated (shown by red arrows). b, Platelet force distribution curve translated from (a) into polar coordinates. Polarity of the force distribution is quantified based on the curves. c-d, histograms of single platelet force intensity shows a wide distribution of platelet force intensity and polarity, suggesting strong heterogeneity in individual platelet forces. Force intensity is calculated by summing grayscale values of all pixels under single platelets in the ITS images.

