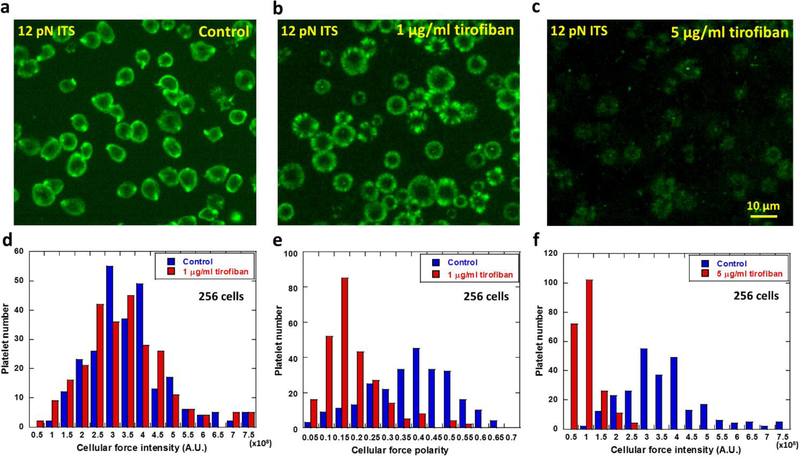
Fig. 4. Polarization and intensity of platelet forces (integrin tension higher than 12 pN) altered by the anti-platelet drug tirofiban.
a, Platelet force map in the control group. b, force map of platelets treated with 1 μg/ml tirofiban. c, force map of platelets treated with 5 μg/ml tirofiban. d, Force intensity histograms of platelets treated with 1 μg/ml tirofiban and the control group. p value = 0.125 between the two groups of platelet force intensities. e, Force polarity histograms of platelets treated with 1 μg/ml tirofiban and the control group. p value < 0.001 between the two groups of platelet force polarities. f, Force intensity histograms of platelets treated with 5 μg/ml tirofiban and the control group. p value <0.001 between the two groups of platelet force intensities.

