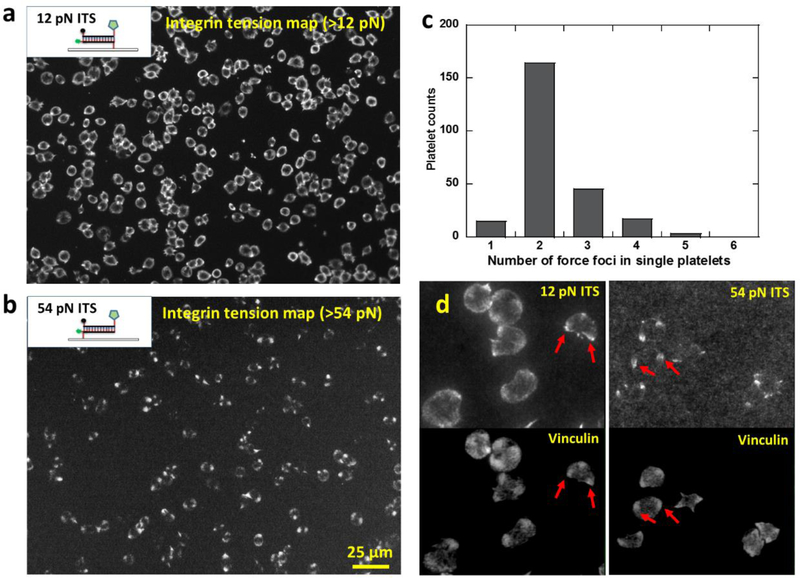
Fig. 5. Platelet force maps of low-level (>12 pN) and high-level (>54 pN) integrin tensions.
a, platelet force map of low-level integrin tensions (above 12 pN) reported by the ITS with a 12 pN tension threshold. The dsDNA of the 12 pN ITS is in an unzipping geometry. b, platelet force map of high-level integrin tensions (above 54 pN) reported by the ITS with a 54 pN tension threshold. The dsDNA of the 54 pN ITS is in a shear geometry. c, histogram of force foci number in the high-level tension map (>54 pN). d, Force foci on both 12 pN and 54 pN ITS surfaces generally co-localize with vinculin clusters which mark the sites of focal adhesions. Examples of co-localizations are shown by red arrows.

