Figure 2:

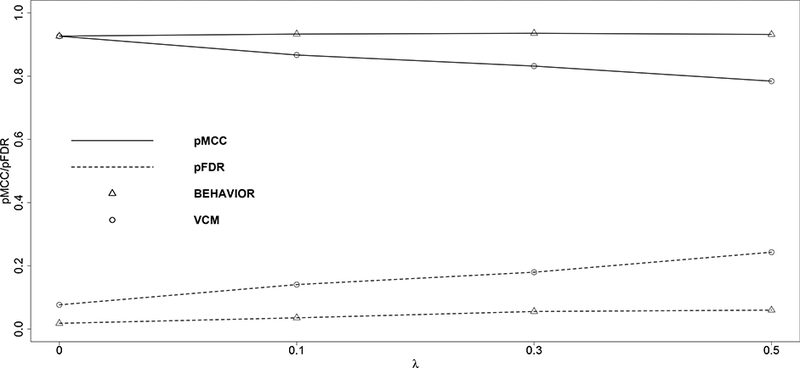
Matthews correlation coefficient (solid lines) and false discovery rate (dashed lines) are plotted against the true values of the thresholds. Triangular markers indicate BEHAVIOR; circular markers indicate VCM.

Matthews correlation coefficient (solid lines) and false discovery rate (dashed lines) are plotted against the true values of the thresholds. Triangular markers indicate BEHAVIOR; circular markers indicate VCM.