Figure 4:

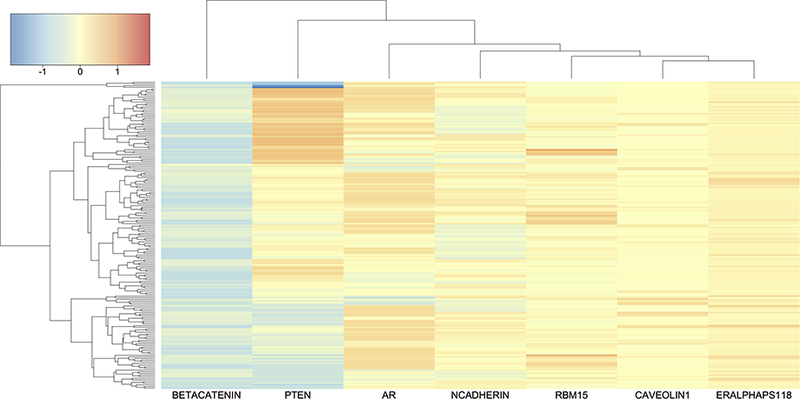
Heatmap of prognostic protein effects βj (Gij) for HNSC. The rows (patients) and columns (proteins) are grouped by hierarchical clustering with complete linkage. Color scale is given in the top left corner.

Heatmap of prognostic protein effects βj (Gij) for HNSC. The rows (patients) and columns (proteins) are grouped by hierarchical clustering with complete linkage. Color scale is given in the top left corner.