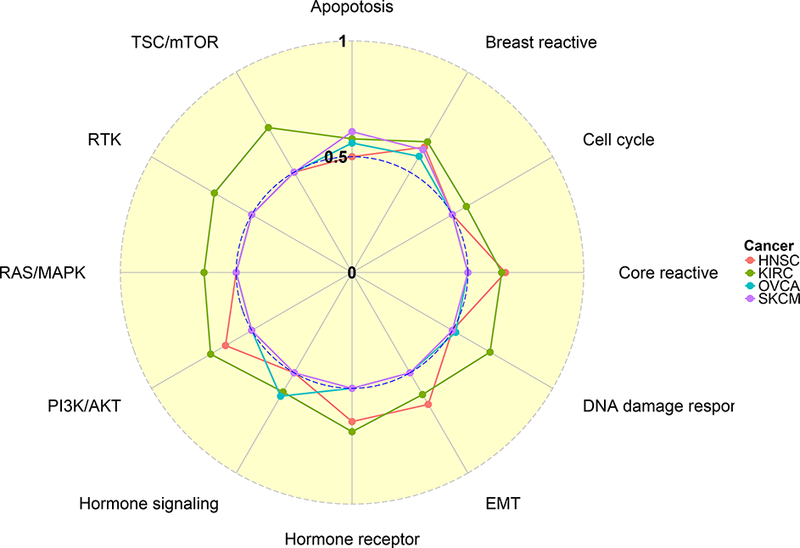
Figure 5:

Radial plot of c-index. C-indices of survival time prediction are computed across 4 cancers and 12 pathways. Pathways are shown at the outer ring and cancer types are represented by different colors, for which the legend key is given on the right. Each dot lies on one of the 12 radii and represents a c-index for a specific pathway/cancer combination. The c-index takes values of 0, 0.5 and 1 at the center, inner ring and outer ring, respectively.
