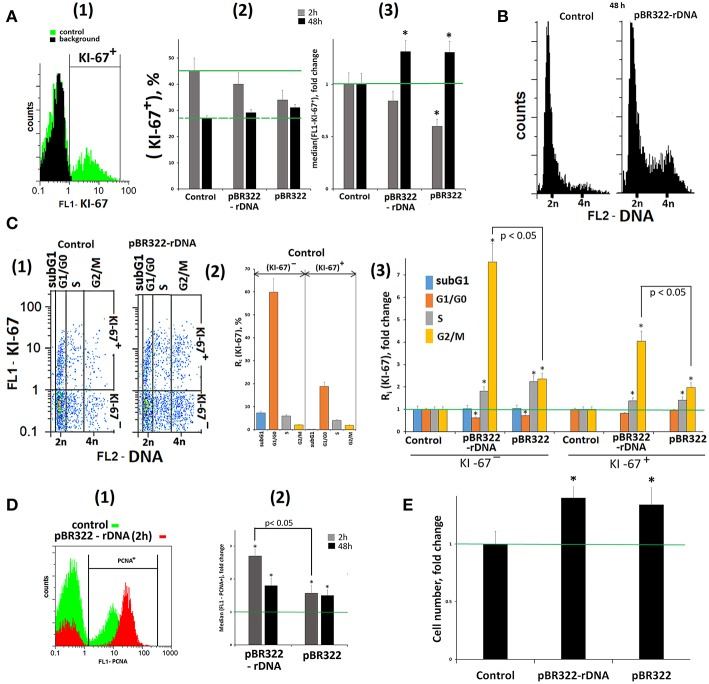
Figure 7.
Proliferation and cell cycle of MCF7 cells exposed to GC-DNAs. (A) (1) FCA. Fixed cells stained with anti-Ki-67 antibodies (green). Background fluorescence was quantified using FITC-conjugated secondary antibodies (black). (2) Proportion of KI-67+ cells in total cell population. (3) The average (n = 3) of the median signal intensities of FL1 (KI-67+). (B) FCA. Distribution of fluorescence intensities of the cells stained with PJ (DNA content). (C) (1) FCA. Cells plots: FL1-KI-67 vs. FL2-DNA. (2) The content in the KI-67+ and KI-67- control populations cells with the amount of DNA corresponding to the SubG1/G0, G1/G0-, S and G2/M phases of the cell cycle. (3) Effect of the plasmids on the relative proportions of the cell with the amount of DNA corresponding to the phases of the cell cycle. Cultivations conditions: GC-DNAs, 50 ng/mL, 48 h. (2 and 3)—the averaged data for three experiments. (D) (1) FCA. Fixed cells stained with anti-PCNA antibodies. (2) The average (n = 3) of the median signal intensities of FL1 (PCNA+). (E) Total number of cells in studied cell population (50 ng/mL GC-DNAs, 48 h). Before the start of the experiments, cells were cultured for 24 h. *p < 0.05 (comparison with the control).

