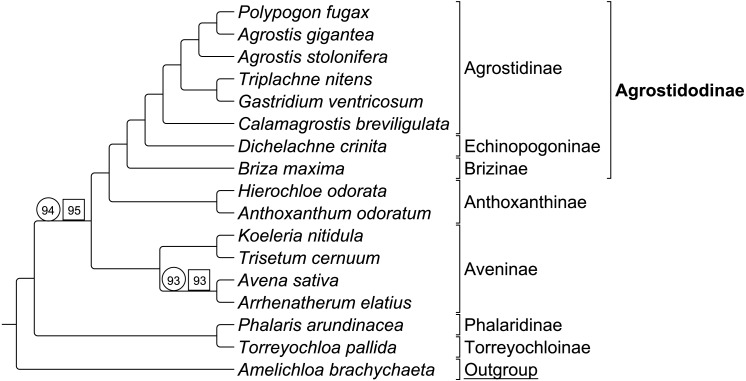
Figure 3. ML BS consensus tree of Group 1 species.
ML BS tree of Group 1 species inferred from aligned sequences. The support values of two nodes, which are less than maximum, are indicated. Support values within circles correspond to sequence only analyses. Support values within squares correspond to sequence + rare genomic change (RGC) analyses. A. brachychaeta serves as the outgroup comparison. Supersubtribe designations are shown in bolded text. Subtribe designations are shown in standard text. Bracketed clades correspond to taxa sensu Soreng et al. (2017).

