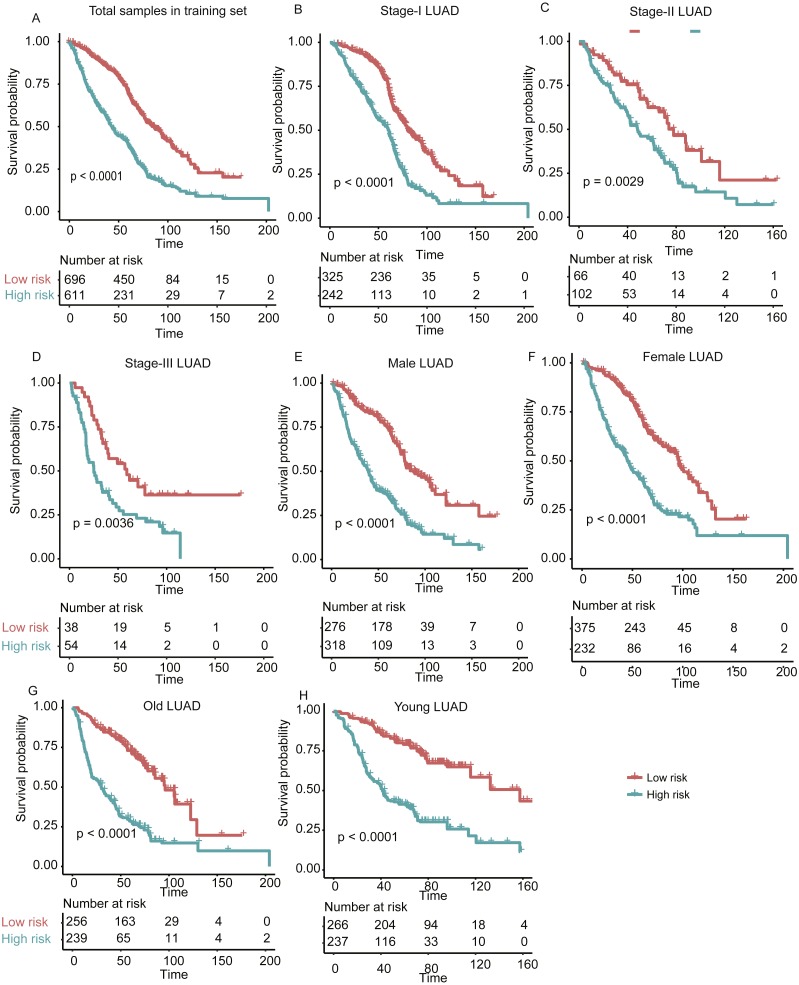
Figure 3. The performance of the stratification for the lung adenocarcinoma in training set based on the prognostic model.
(A) The Kaplan–Meier curves of the poor and good prognosis groups show significant overall survival difference. (B, C, and D) showed the prognostic significance of the stratification in specific TNM stage, and (E and F) and (G and H) showed the survival difference between patients of high- and low-risk group from specific gender and age group, respectively.

