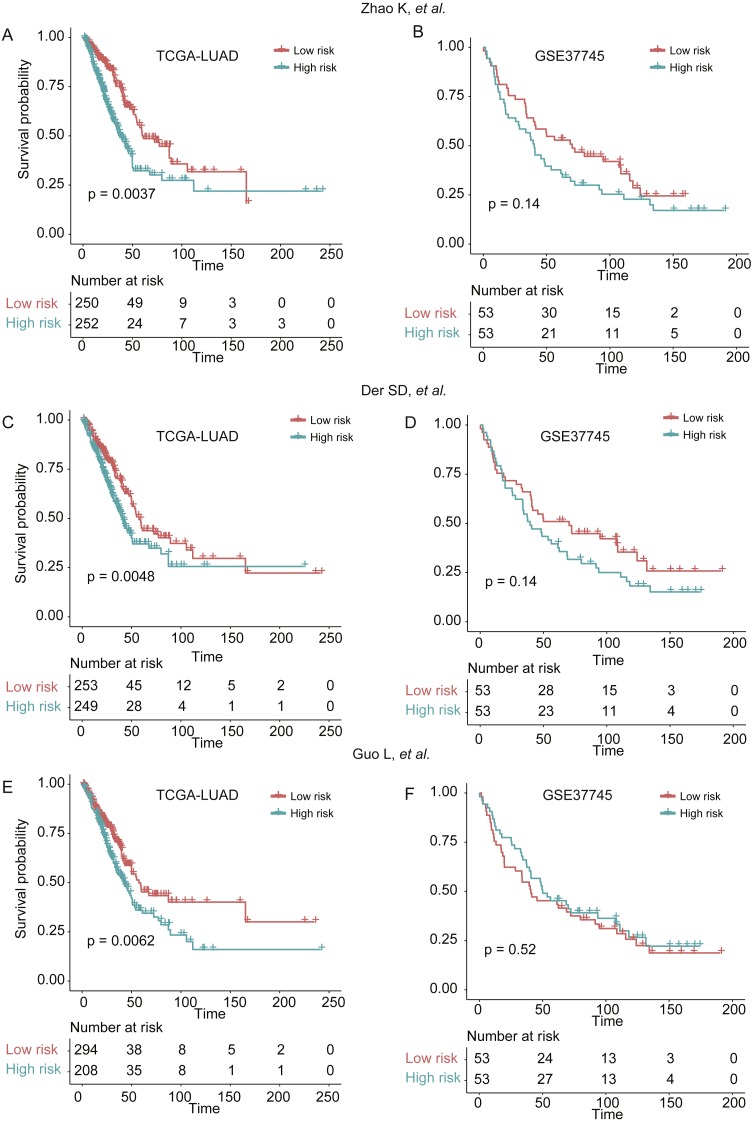
Figure 6. The performance of three prognostic gene sets in the two validation sets.
The performance of the cox models built by three prognostic gene sets by Zhao, Li & Tian (2018), Der et al. (2014) and Guo et al. (2006) were visualized by Kaplan–Meier curves in (A and B), (C and D), and (E and F), respectively.

