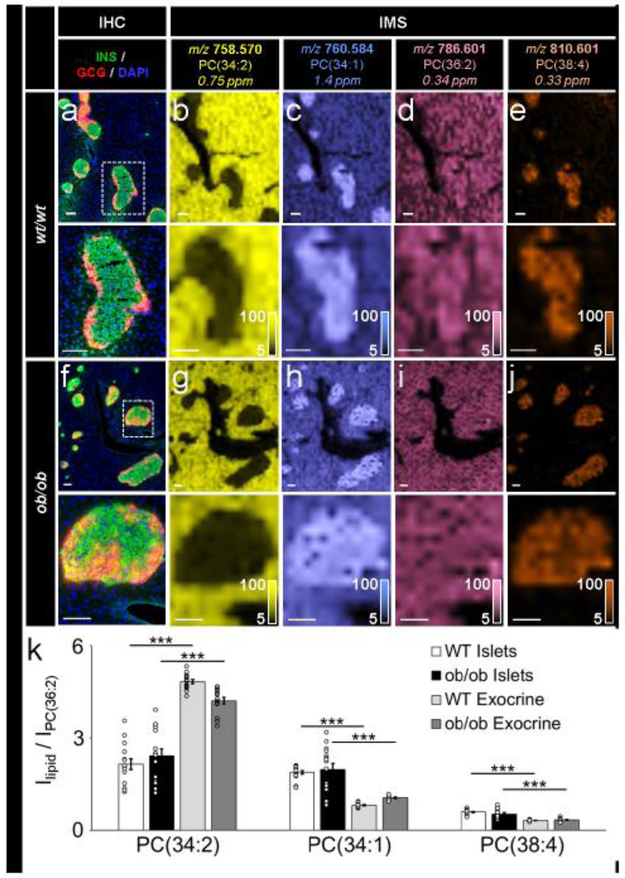
Fig. 3.
IMS was reproducible and allowed for relative quantification of lipids of interest. (a–e) Immunostaining (green, C-peptide; red, glucagon; blue, DAPI) and false-colour 30 μm spatial resolution IMS from serial tissue sections showing the spatial distribution of a series of PC ions in wt/wt mouse pancreatic tissue, (f–j) Immunostaining (colours as in a) and false-colour 30 μm spatial resolution IMS from serial tissue sections showing the spatial distribution of a series of PC ions in oblob mouse pancreatic tissue. Lipids were identified by accurate mass measurements (ppm error reported). Ion images have been normalised to PC(36:2) (a lipid expressed homogenously throughout each tissue) and are shown with pixel interpolation. Magnifications of the areas highlighted with white dotted lines in the IHC images are shown below each IHC and IMS image. Intensity scales of the false-colour IMS images are shown in the bottom right of each magnified image, (k) Intensity values (I), presented as mean ± SEM, represent the average of five islets each from three biological replicates (15 total islets) in each tissue type (***p≤0.001). PC signals were normalised to PC(36:2). All scale bars are 100 μm. C-PEP, C- peptide; GCG, glucagon

