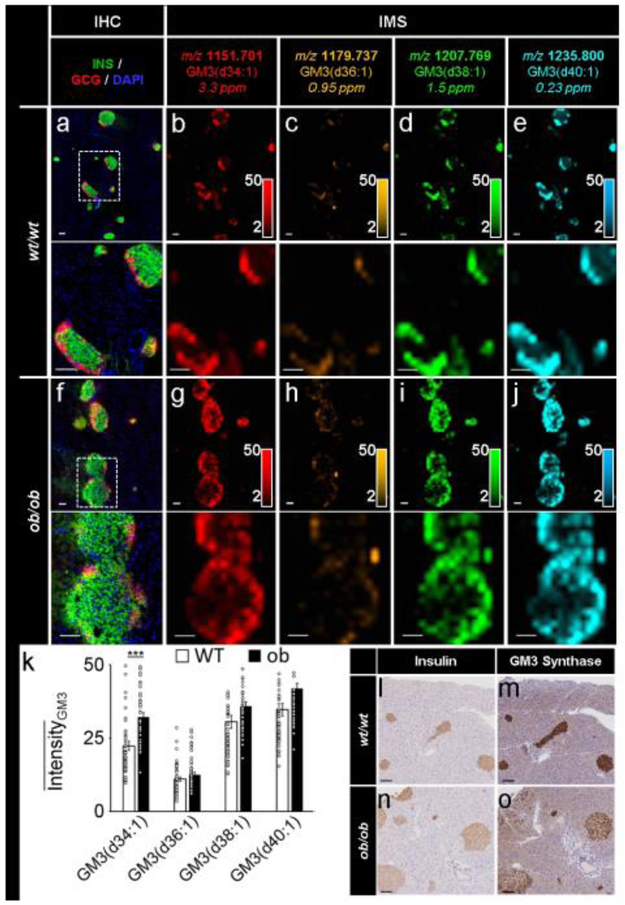
Fig. 4.
IMS enabled the detection of specific GM3 ganglioside isoforms in murine pancreases. (a–e) Immunostaining (green, C-peptide; red, glucagon; blue, DAPI) and false-colour 30 μm spatial resolution IMS from serial tissue sections showing the spatial distribution of a series of GM3 ganglioside ions in wt/wt mouse pancreatic tissue. (f–j) Immunostaining (colours as in a) and false-colour 30 μm spatial resolution IMS from serial tissue sections showing the spatial distribution of a series of GM3 ganglioside ions in ob/ob mouse pancreatic tissue. Lipids were identified by accurate mass measurements (ppm error reported). Ion images were normalised to TIC and are shown with pixel interpolation as ±0.05 Da. Magnifications of the areas highlighted with white dotted lines in the IHC images are shown below each IHC and IMS image. Intensity scales of the false-colour IMS images are shown in the bottom right of each magnified image. (k) Intensity values, presented as mean ± SEM, represent the average of ten islets each from five biological replicates (50 total islets) in each tissue type (***p≤0.001). GM3 signals were normalised to TIC prior to data export. (l–o) GM3 synthase immunostaining of serial tissue sections of a wt/wt. mouse pancreas (l, insulin; m, GM3 synthase) and an ob/ob mouse pancreas (n, insulin; o, GM3 synthase). All scale bars are 100 μm. C-PEP, C-peptide; GCG, glucagon

