
Figure 5.
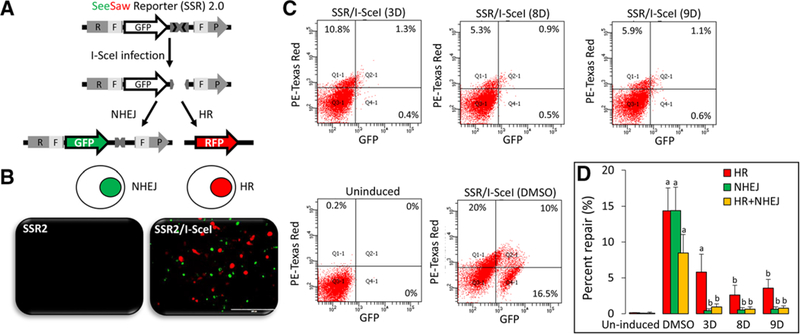
Inhibition of DNA repair by SFN analogs. A) A schematic representation of the See Saw reporter SSR 2.0, as published.[18] B) Images of HCT116 cells transfected with SSR 2.0 for 24 h (left panel), followed by transfection with I-SceI for 6 h (right panel) to induce DNA damage response, as indicated by HR-mediated (red) or NHEJ-mediated repair (green) fluorescence. C) SH-SY5Y cells were co-transfected with SSR 2.0/I-SceI and treated with 5 μm of SFN analogs for 6 h, as described in Experimental Section. Percent NHEJ (GFP) or HR (RFP) was measured via flow cytometry in negative controls without I-SceI (Uninduced), positive controls (SSR 2.0/I-SceI, DMSO), and test samples (SSR 2.0/I-SceI, treated with SFN analogs). D) Percentage NHEJ or HR quantified from three independent experiments, mean ± variance. a) p < 0.05 (DMSO vs. uninduced), b) p < 0.05 (DMSO vs. treatment), analyzed by one-way ANOVA.