
Figure 6.
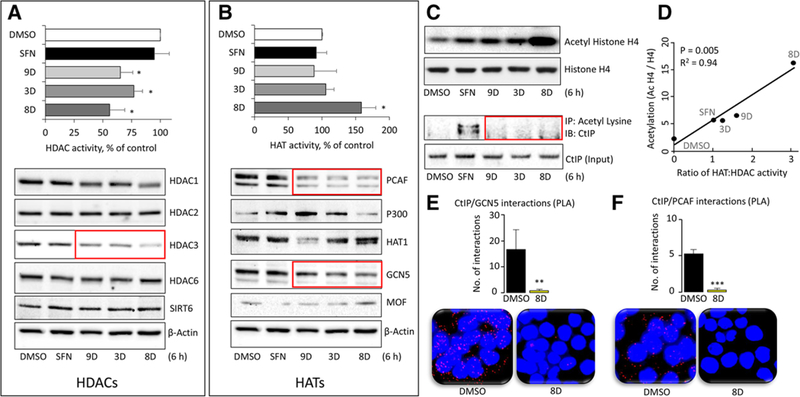
HAT and HDAC changes produced by SFN analogs. HCT116 cells were treated with DMSO (vehicle) or 15 μm SFN or its analogs for 6 h and whole cell lysates were examined for A) HDAC activity (top panel) or HDAC protein expression, with β-actin as loading control in the immunoblots (bottom panel). B) Repeat of the experiments in (A), but for HATs. C) Histone H4 acetylation, normalized to histone H4 (top panel) assessed by immunoblotting, and CtIP acetylation changes normalized to CtIP input controls (bottom panel) by immunoprecipitation after Ac-Lys pull-down. D) The ratio of HAT:HDAC activity (from A,B) and the level of histone acetylation (densitometry from C) were plotted for each compound. Data are representative ofthree experiments (*p < 0.05 vs. DMSO). E,F) In HCT116 cells, proximity ligation assays (PLA) identified endogenous interactions ofCtIP:PCAF and CTIP:GCN5 proteins in situ (red dots). DAPI-stained nuclei (blue). Cells were imaged 6 h after treatment with DMSO (vehicle) or analog 8D, and the interactions per nuclei were quantified and averaged across five different microscopic fields. Data = mean ± SE, **p < 0.01, ***p < 0.001 for 8D versus vehicle controls using Student’s t-test. Data are representative of at least three independent experiments.