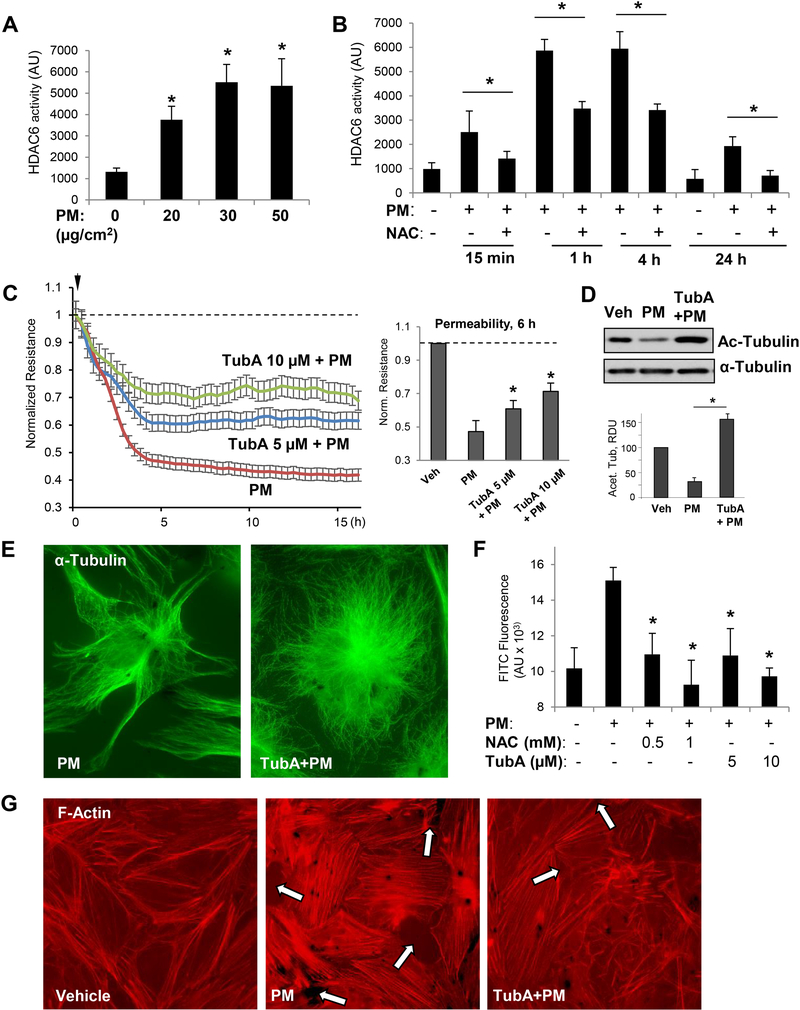
Figure 3. PM-induced EC barrier disruption is mediated via HDAC6 activation.
Cells were treated with indicated concentrations of PM (A) or stimulated with 20 μg/cm2 PM with or without NAC (1 mM, 30 min) pretreatment for indicated periods of time (B), and HDAC6 activity assay was carried out as described in Methods; n=3, *p<0.05. C - TER was monitored across HPAECs monolayers challenged with PM in the presence or absence of HDAC6 inhibitor, Tubastatin (TubA, 5 μM or 10 μM). Bar graph depicts TER measurements performed in EC monolayers stimulated with PM with and without TubA pretreatment after 6 hrs of PM exposure; n=3; *p<0.05. Data are expressed as mean + SD. D - Cell lysates prepared from EC exposed to PM (6 hrs) with or without TubA pretreatment were analyzed by Western blotting with acetylated α-tubulin antibody. Bar graphs depict quantitative densitometry analysis of western blot experiments; n=3; **p<0.05. Data are expressed as mean + SD. E - Immunofluorescence analysis of microtubule cytoskeleton in EC exposed to PM with or without TubA pretreatment was performed using α-tubulin antibody. Results are representative of three independent experiments. F - Cells seeded on biotinylated gelatin-coated plates were pretreated with NAC (0.5, 1 mM) or TubA (5, 10 μM) for 30 min followed by PM challenge for 6 h. After incubation with FITC-avidin for 3 min, excess FITC was washed and fluorescence intensity of immobilized FITC-avidin was analyzed using microplate reader; n=5, *p<0.05. G - Pulmonary EC with or without TubA pretreatment (10 μM, 30 min) were stimulated with PM (20 μg/cm2, 6 hrs) and subjected for immunofluorescence staining to visualize F-actin with Texas Red phalloidin. Paracellular gaps are marked by arrows. Results are representative of three independent experiments.

