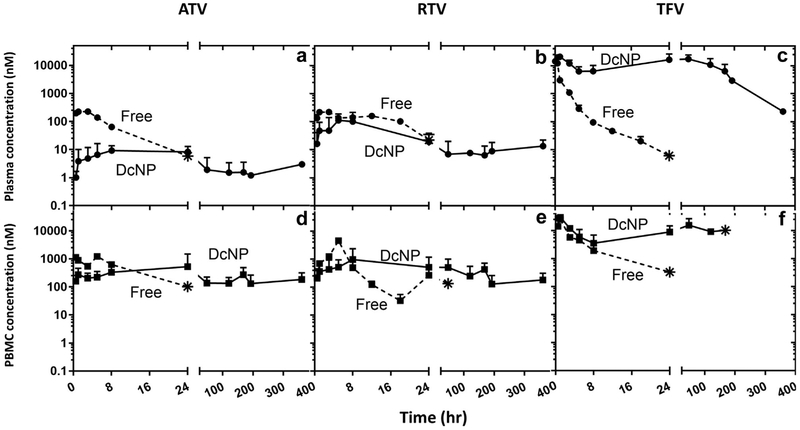
Figure 2.
Effects of DcNP formulation ATV, RTV, and TFV on plasma and blood mononuclear cells in nonhuman primates. A single subcutaneous dose of ATV, RTV, and TFV drug was administered as nanocombination (DcNP) or as free drug equivalent. The 3 drug concentrations in plasma and PBMCs were monitored over 14 d (336 h). Upper panels (a-c) describe plasma concentration comparison of DcNP (solid lines) and free drugs (dash lines). Lower panels (d-f) describe time-course of PBMC concentration comparison of DcNP (solid lines) and free drugs (dashed lines). Free drugs were scaled to dosages equivalent to those in DcNP. Circle symbols are plasma timepoints. Square symbols are PBMC timepoints. Star symbols represent the last detectable timepoint. Limit of detection 0.01-0.03 pmol/mL. No data points were plotted for measured drug levels that fell below the limit of detection. Data expressed were geometric mean (±SD).

