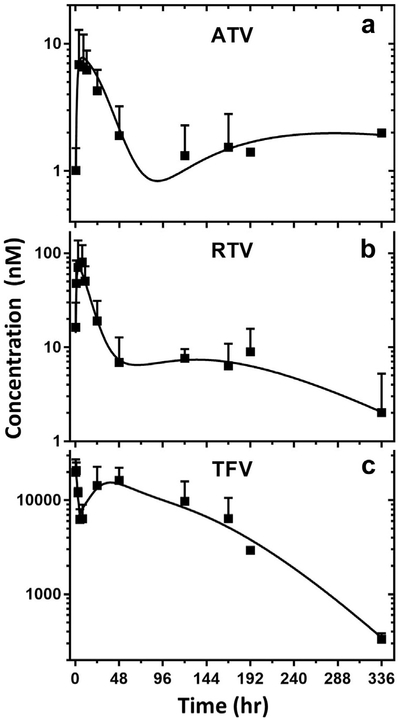
Figure 4.
The plasma time-course of experimental and fitted data for TLC-ART 101 based on the MBPK model. MBPK-predicted and experimental average plasma concentration-time profiles for ATV (panel A), RTV (panel B), and TFV (panel C) are presented. The regression analysis of the fitted time-course drug concentration provides R2 of 0.94, 0.90, and 0.96 for ATV, RTV, and TFV, respectively. The model parameter estimates are presented in Table 6. Model prediction is displayed as solid lines and observed DcNP data as squares (geometric mean ± CV), for panel a: DcNP ATV, panel b: DcNP RTV, and panel c: DcNP TFV.

