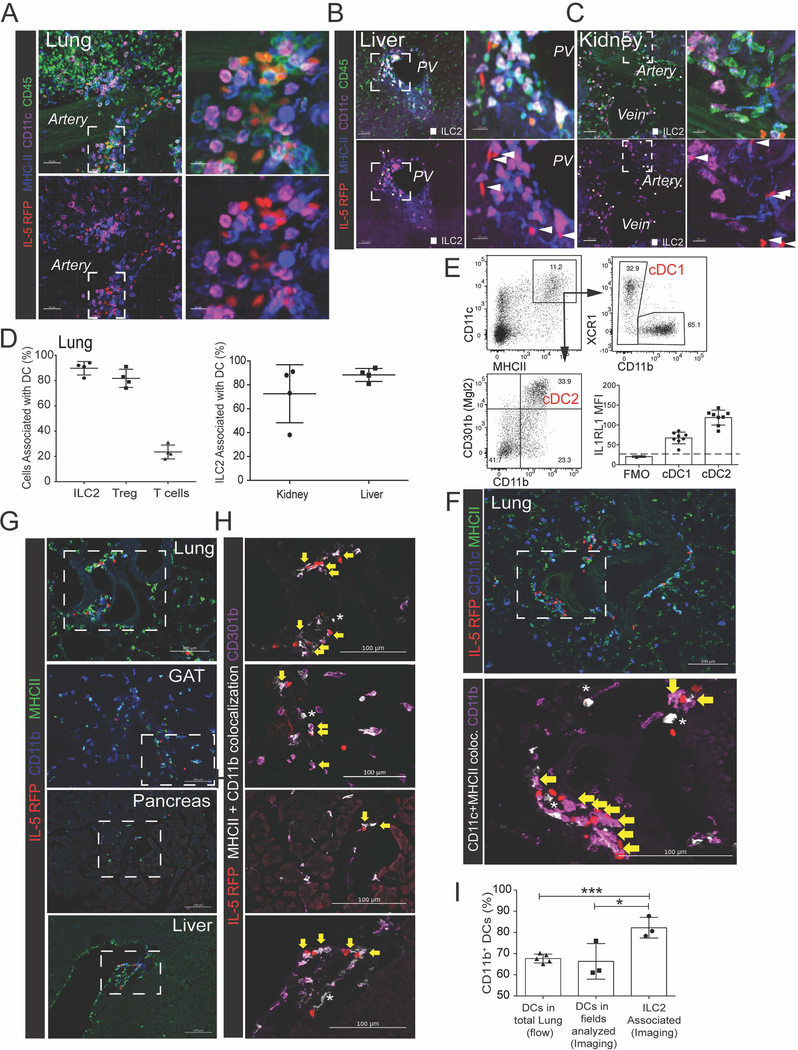
Figure 2: ILC2s are associated with CD11b+ dendritic cells at cuff sites.
(A-C) 3D rendering with zoom of 200μm projections from (A) lung, (B) liver, or (C) kidney, highlighting IL-5 RFP+ ILC2 and CD11c+ MHCII+ myeloid cells, most consistent with dendritic cells (DCs). (D) Image analysis of 3D thick sections from lung, liver, and kidney for indicated populations; association defined as <900nm between the nearest ILC2 and DC surface vertices. (E) Flow cytometry analysis of lung DC subsets. (F-I) 2D-thin cut images of ILC2 localization (yellow arrows) with (F) CD11b+ DCs or (G and H) CD301b+ CD11b+ DCs from indicated tissues, with (I) quantification of co-localization. Occasional CD11b-neg DCs (F) or CD301b-neg DCs (G) are indicated with stars. (A-C, E-H) Representative of three or more mice. (D,I) Data points represent averages of individual mice n=3–4 with >n=25 cells analyzed for per animal. See also Figure S3.

