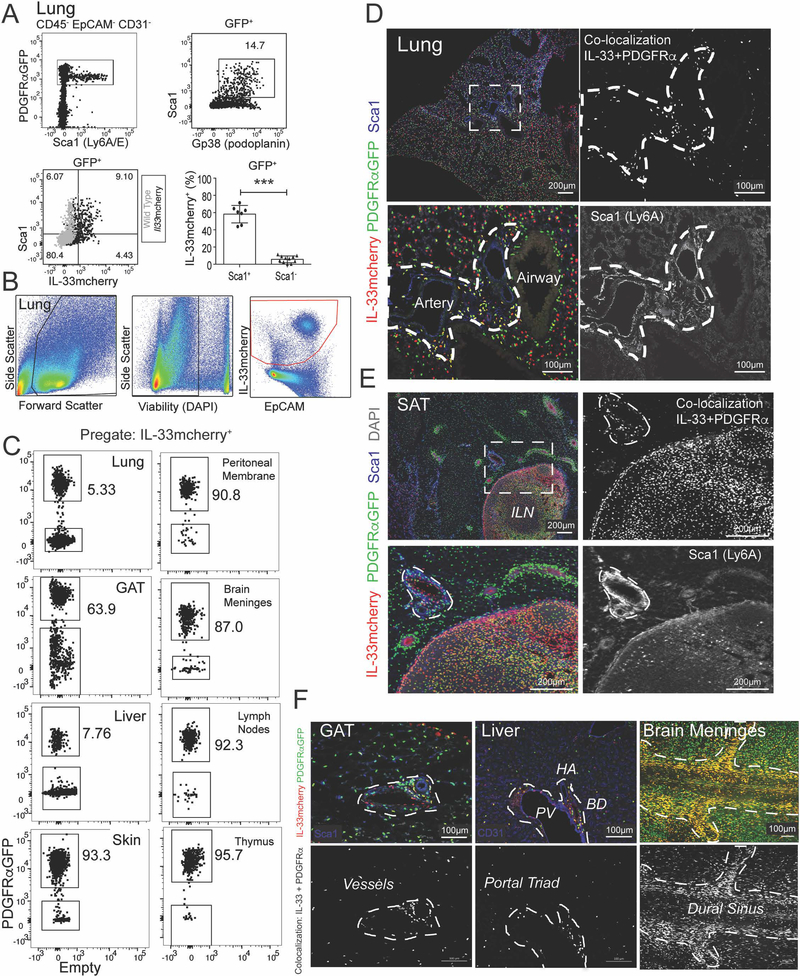
Figure 4: ASCs express IL-33mcherry, Sca1 and Gp38 and are widely distributed in tissues.
(A-C) Flow cytometry plots and quantification from (A) lung of PDGFRαGFP+ IL-33mcherry mice (black) or wild-type gating controls (grey) or (B and C) indicated tissues, including pre-gating strategy. (D and E) 2D thin-cut images with zooms from (D) lung or (E) subcutaneous adipose tissue (SAT) with inguinal lymph node (ILN) or (F) gonadal adipose tissue (GAT), liver, and brain meninges, with antibody stains indicated and PDGFRαGFP – IL33mcherry colocalization highlighted (white). Flow cytometry plots and images are representative of three or more mice. See also Figure S4.

