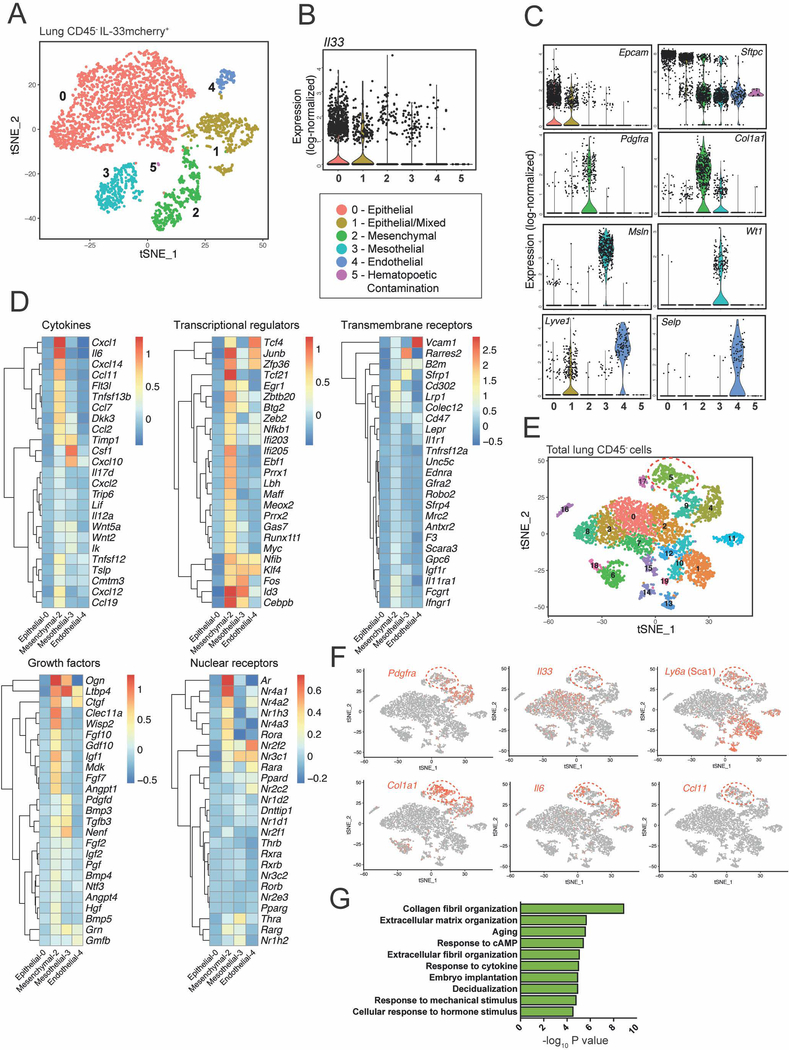
Figure 5: ASCs are a distinct IL-33 expressing fibroblast-like subset expressing genes associated with matrix remodeling and inflammation.
(A) Unsupervised clustering analysis of scRNAseq on IL-33mcherry+ CD45− cells from naïve lung visualized with t-SNE. Each dot indicates an individual cell (total cell number: 3584). A mixed subset comprising apparent epithelial with endothelial cell doublets (cluster 1) and a small hematopoietic contaminating subset (cluster 5) were identified and not analyzed further. (B and C) Violin plots of (B) Il33 or (C) selected genes used to assign cluster identity. (D) Heatmaps of mean expression values of top 25 genes in ASCs (cluster 2) in indicated gene category across clusters identified in (A). Data is log-transformed. Genes were assigned to categories using Ingenuity Pathway Analysis (IPA). (E) Unsupervised clustering of aggregated total CD45-negative and IL-33+ (mCherry+) cells from naïve lung visualized with t-SNE. Each dot indicates an individual cell (total cell number: 5392). (F) Gene expression of ASC-associated genes projected onto tSNE plots. (G) Gene ontology analysis in DAVID of cluster 5 differentially expressed genes. See also Figure S5 and Table S1.

