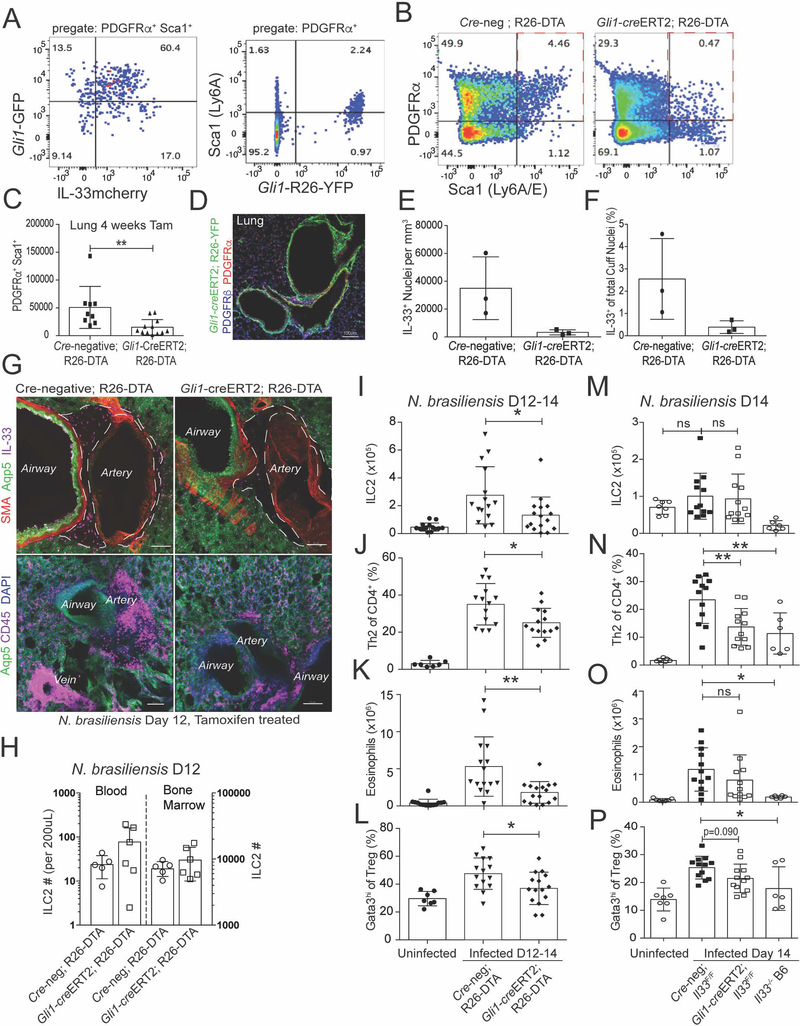
Figure 7: ASCs support ILC2s and the induction of lung type 2 inflammation.
(A) Flow cytometry analysis of lungs from Gli1-GFP mice (left) or Gli1-creERT2; R26-YFP tamoxifen treated lineage trackers (right). (B and C) Gli1-creERT2; R26-DTA mice (tamoxifen treated) with (C) enumeration of ASC depletion. (D) Lung 2D thin-cut image from Gli1-creERT2; R26-YFP tamoxifen treated mice. (E-G) 3D imaging with quantitation of ASC-replete (Cre-neg; R26DTA) or ASC-deplete (Gli1-creERT2+; R26-DTA) IL-33+ nuclei in adventitial cuff spaces at day 12 PI with N. brasiliensis (H-P) Flow cytometry quantification of (H) blood and bone marrow or (I-P) lungs from tamoxifen treated N. brasiliensis infected mice at PI D12–14 from the indicated strains (ASC-depleted, ASC-IL-33 Flox), quantifying ILC2s, eosinophils, Th2 cells, and Gata3hi Treg cells. (A,B,D,G,H) Representative plots, images, or experiments from 2 or more mice. (C, I-P) Pooled data from greater than 3 experiments, with individual mice shown. (E,F) Three individual mice analyzed for each genotype. See also Figure S7.

