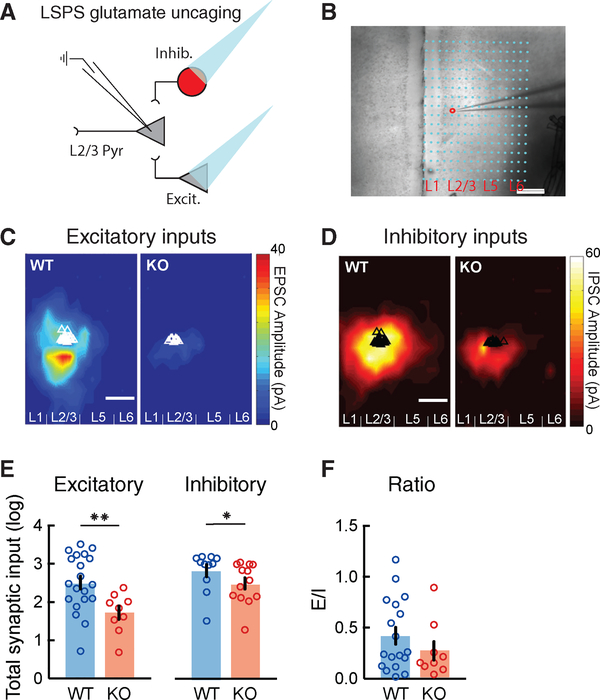
Figure 1. Reduced Excitatory and Inhibitory Synaptic Inputs to L2/3 Pyramidal Neurons in the mPFC of Cntnap2 KO Mice.
(A) Schematic of laser-scanning photostimulation (LSPS) via glutamate uncaging paradigm, combined with whole-cell patch-clamp recordings of L2/3 pyramidal (Pyr) neurons in acute slices of the medial prefrontal cortex (mPFC). Patched neurons were clamped at −70 or +5 mV for the detection of local excitatory or inhibitory synaptic connections arising from photostimulated presynaptic glutamatergic (Excit.) and GABAergic (Inhib.) neurons.
(B) Example of an LSPS experiment in an mPFC slice, in which differential interference contrast imaging was used for tissue visualization. Photostimulation sites are superimposed (dots) and spaced within a 100-μm × 60-μm grid. The red circle indicates the location of the recorded glutamatergic neuron in L2/3, approached by the patch pipette.
(C and D) Group-averaged excitatory (C) and inhibitory (D) input maps of L2/3 excitatory neurons for WT (n = 20 cells from 3 mice in C; n = 11 cells from 3 mice in D) and KO (n = 9 cells from 3 mice in C; n = 13 cells from 3 mice in D) mice. Triangles indicate the location of individually recorded neurons.
(E) Average total synaptic excitatory and inhibitory input strength (log) measured for L2/3 excitatory cells depicting a robust decrease in the KO mice, compared to WT mice (WT: EPSC 2.51 ± 0.17, n = 20 cells; KO: EPSC 1.72 ± 0.17, n = 9 cells; WT: IPSC 2.83 ± 0.16, n = 11 cells; KO: IPSC 2.49 ± 0.15, n = 13 cells; EPSC: **p = 0.0051, IPSC: *p = 0.0218; Wilcoxon test).
(F) Average ratios of total EPSCs over IPSCs from individual cells (WT: n = 17 cells; KO: n = 8 cells). There is no significant difference in E/I ratio between WT and KO (p = 0.8873; unpaired t test). Scale bars: 200 μm.
All errors bars indicate the SEM.

