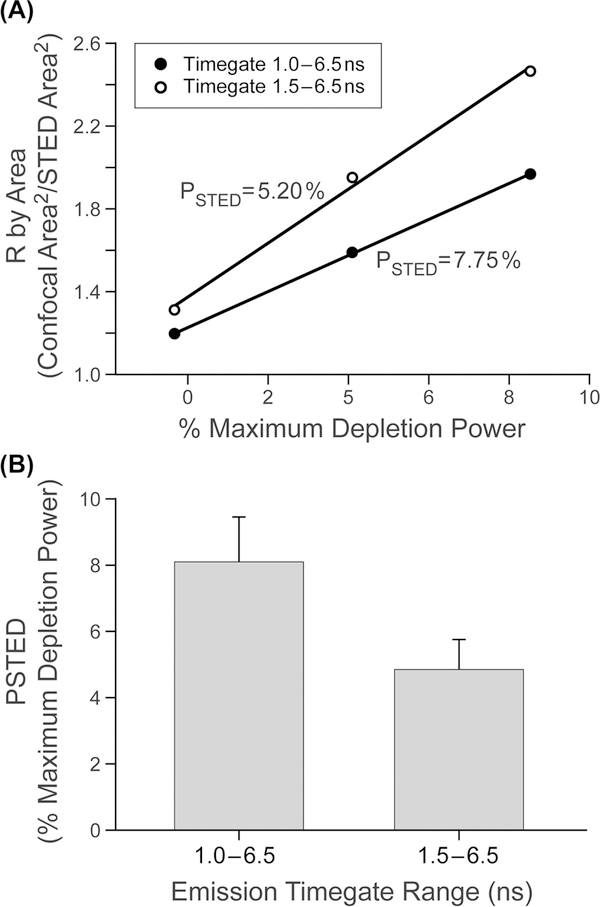
Fig. 4.
Example of the use of the linearisation method to show the utility of PSTED measurement using two different emission time gates on the same dye. (A) Example plots of R as a function of STED depletion power for two different emission time gating windows (and 592 nm STED depletion) for the dye Alexa 488. PSTED was calculated from the reciprocal of the slope of the fitted lines (R2 ≥ 0.99) in A. (B) Mean and standard deviation of PSTED as a function of time-gate window (n = 8).

