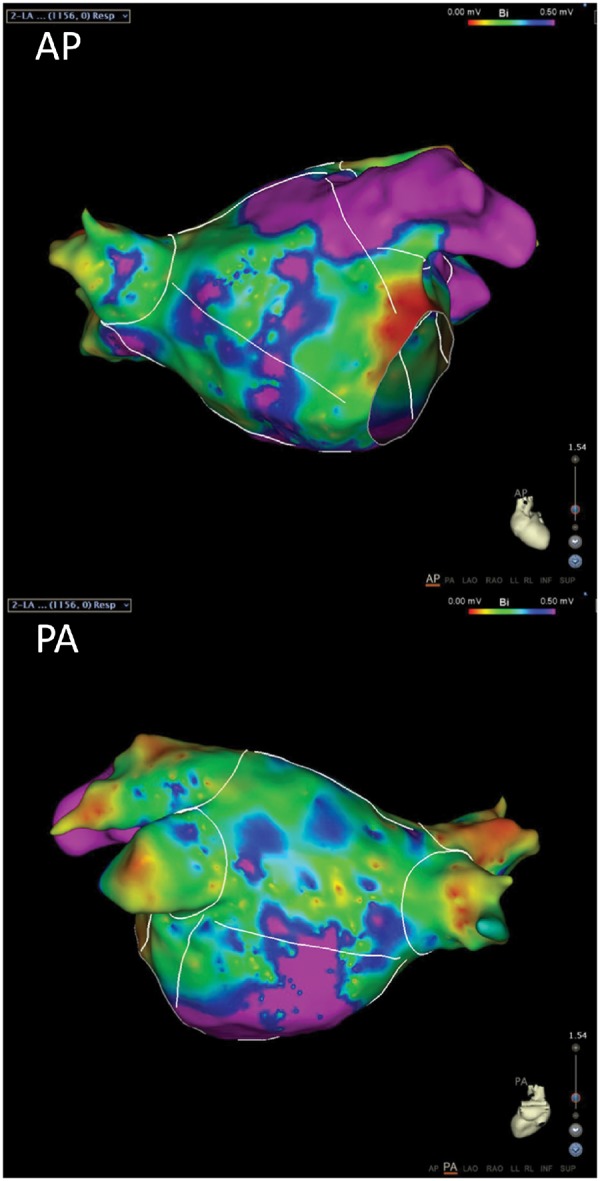
Figure 1.

Representative electroanatomic bipolar voltage maps of the left atrium of a patient with cardiac amyloidosis. White lines indicate boundaries and analysed left atrial segments. The voltage scale indicates all purple areas as normal voltage; all others are low voltage. Note the great extent of low-voltage area. AP, anteroposterior; PA, posteroanterior. Reprinted with permission of Barbhaiya et al.17
