Figure 3.

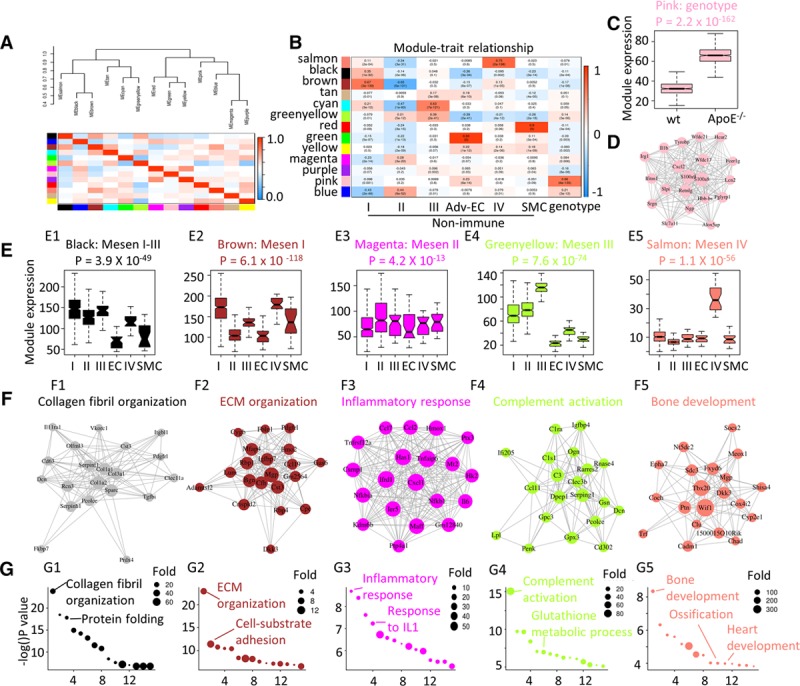
Gene expression dynamics of the nonimmune population. A, Eigengene network showing the clustering dendrogram with dissimilarity based on topological overlap and intercorrelation of each module identified by WGCNA. Color indicates modules. Color key indicates the correlation value. B, Correlation of gene modules with cell cluster identity (Mesen I–IV, adventitial endothelial cell [Adv-EC], and smooth muscle cell [SMC]) and genotype. Content in each cell represents the correlation value (first row) and the P value (second row). C, Gene expression distribution of genes from the pink module in wt (wild type) and ApoE (apolipoprotein E)−/− mesenchyme cells were shown by box plot. D, Gene ontology (GO) terms (biological function) analysis of pink module genes. E, Gene expression distribution of module genes in each mesenchyme cell cluster (Mesen I–IV) was shown by box plot. F, Correlation network of the top 20 (by decreasing gene-module membership) genes in each module. Size of the node is in proportion to the gene-module membership, and the length of the link is in reverse correlation with the gene-gene correlation. G, GO terms (biological function) analysis of genes from each module. Colors indicate the module names. EC indicates endothelial cell; ECM, extracellular matrix; and IL1, interleukin 1.
