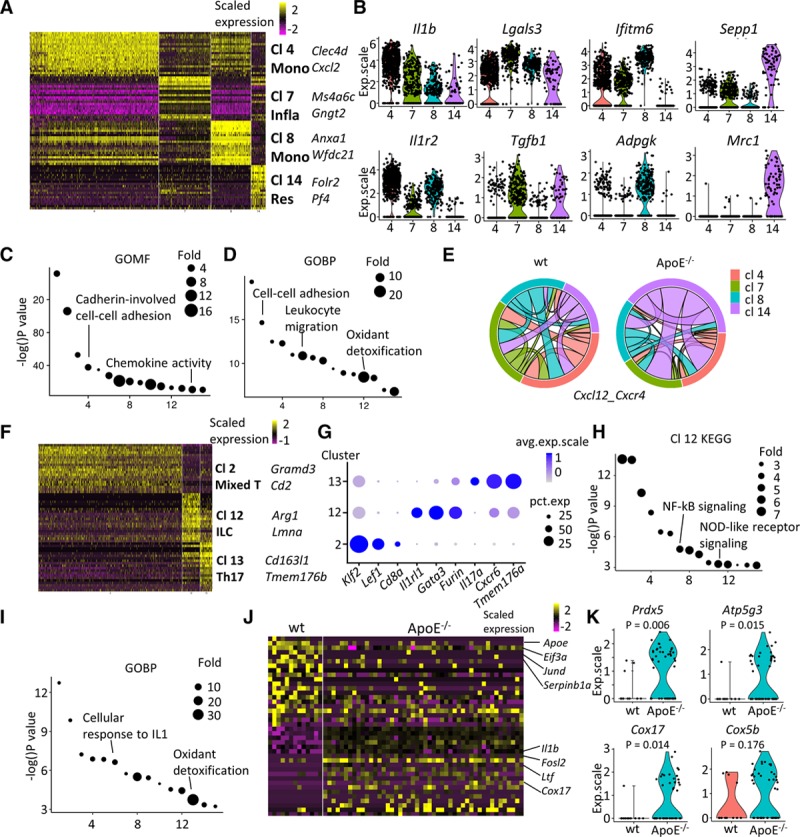
Figure 5.

Characterization of immune cells from the adventitia. A–D, Monocyte-macrophages (clusters [Cl] 4, 7, 8, and 14). A, Heatmap of top 20 (by average log[fold change]) marker genes for each monocyte-macrophage Cl in comparison to the rest of the population. B, Violin plots of selected markers. C, Gene ontology (GO) term (molecular function) analysis of Cl 14 macrophages with its marker genes. D, GO term (biological pathway) analysis of genes significantly upregulated in Cl 14 resident–like ApoE (apolipoprotein E)−/− macrophages in comparison to wt (wild type) analogy. E, Predicted interaction of Cxcl12 and Cxcr4 of wt and ApoE−/− macrophages. The same color of link with the Cl indicates that cells from this Cl contribute to the interaction as ligand. Same band color at both ends of the link illustrates interaction within this cell type. F–K, T lymphocytes and innate lymphoid cells (Cl 2, 12, and 13). F, Heatmap of top 20 (by average log[fold change]) marker genes for each Cl relative to the rest of T lymphocytes. G, Dot plot of selected marker genes for each Cl of T lymphocytes. H, Kyoto encyclopedia of genes and genomes (KEGG) analysis of marker genes in Cl 12 innate lymphoid cells. I, GO terms (biological process) analysis of enriched (average log[fold change], >0.25) genes in ApoE−/− Cl 12 innate lymphoid cells in comparison with the corresponding wt cells. J, Heatmap of top 20 (by decreasing P) enriched genes ApoE−/− Il1rl1-positive T lymphocytes compared with corresponding wt cells. K, Violin plots of selected markers in ApoE−/− Il1rl1-positive T lymphocytes compared with corresponding wt cells. ApoE indicates apolipoprotein E; exp.scale, scaled expression; GOBP, gene ontology biological pathway; GOMF, gene ontology molecular function; ILC, innate lymphoid cell; Infla, inflammatory macrophage; NF-κB, nuclear factor kappa B; NOD, nucleotide-binding oligomerization domain; and Res, resident-like macrophage.
