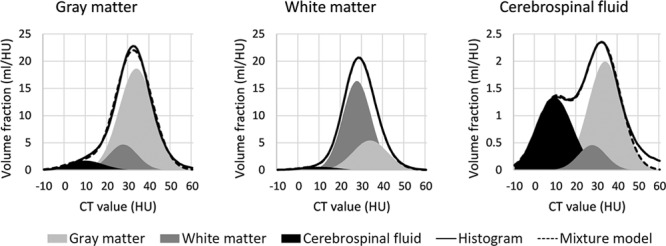
Figure 1.

Gaussian mixture models fitted to noncontrast computed tomography (CT) histograms. An example of gaussian mixture models fitted to 3 noncontrast CT histograms: coarsely segmented gray matter, white matter, and cerebrospinal fluid (CSF). The solid line represents the measured intensity histogram, whereas the dashed line represents the mixture model. The mixture model consists of 3 gaussian distributions: gray matter (light gray; mean, 33.6 HU), white matter (dark gray; mean, 27.0 HU), and CSF (black; mean, 9.5 HU). Note that the gray matter histogram is dominated by the gray matter peak, the white matter histogram by the white matter peak, and the CSF histogram by both the CSF and gray matter peaks.
