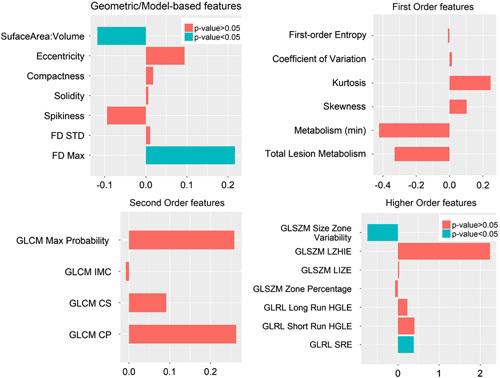
Fig. 2.

Bar plots illustrating differences in median values of individual texture parameters left after excluding highly correlated features. Four subplots are generated after grouping texture features together. Bars pointing toward the left indicate that corresponding texture features were lower in the treatment group versus the control group. Statistically, significant differences are indicated in blue. FD, fractal dimension; FD-STD, FD-standard deviation; GLCM, gray-level co-occurrence matrix; GLCM CP, GLCM cluster prominence; GLCM CS, GLCM cluster shade; GLCM IMC, GLCM information measure correlation; GLRL, gray-level run-length; GLRL long run HGLE, GLRL long run high gray-level run emphasis; GLRL-SRE, GLRL short-run emphasis; GLSZM, gray-level size zone matrix; GLSZM LIZE, GLSZM low-intensity zone emphasis; GLSZM LZHIE, GLSZM long zone high-intensity emphasis.
