Figure 1.
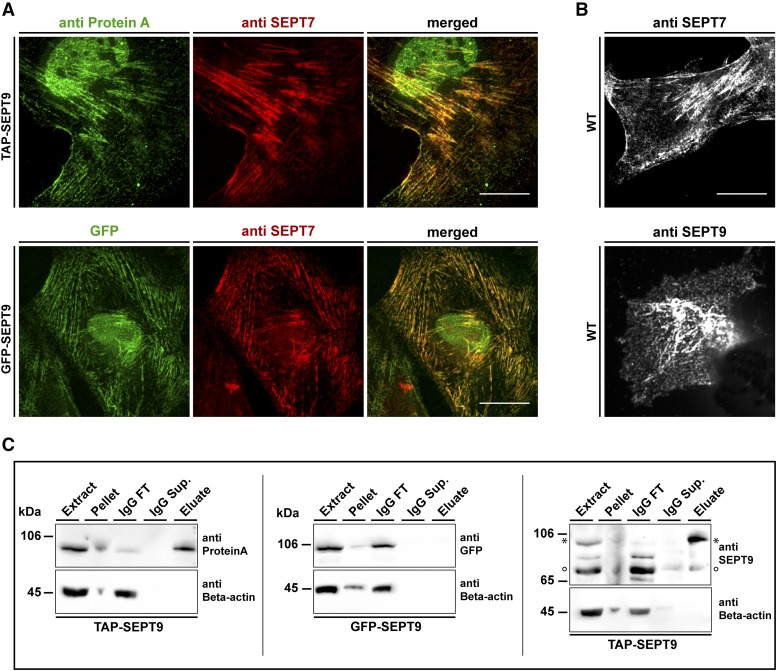
Cell lines and workflow for AP-MS of SEPT9 complexes. A) Characterization of the used cell lines. The colocalization of GFP-SEPT9 (upper panel) and TAP-SEPT9 (lower panel) with the endogenous septin cytoskeleton was probed by immunostaining of SEPT7. TAP-SEPT9 was visualized via an anti-ProteinA antibody. B) 1306 wild type fibroblasts were stained with anti SEPT9 and anti-SEPT7 antibodies. Scale bars represent 20 µm. C) Western blot analysis of the consecutive steps of the AP. Samples of the cell extract, pellet, supernatant of the beads after coupling (IgG sup.), washing step (IgG wash) and the eluate were separated by SDS-PAGE and Western blot was performed using an anti-ProteinA, anti-GFP or anti-SEPT9 antibody, respectively. The band marked with an asterisk represents TAP-SEPT9. The band marked with a circle represents the endogenous SEPT9.

