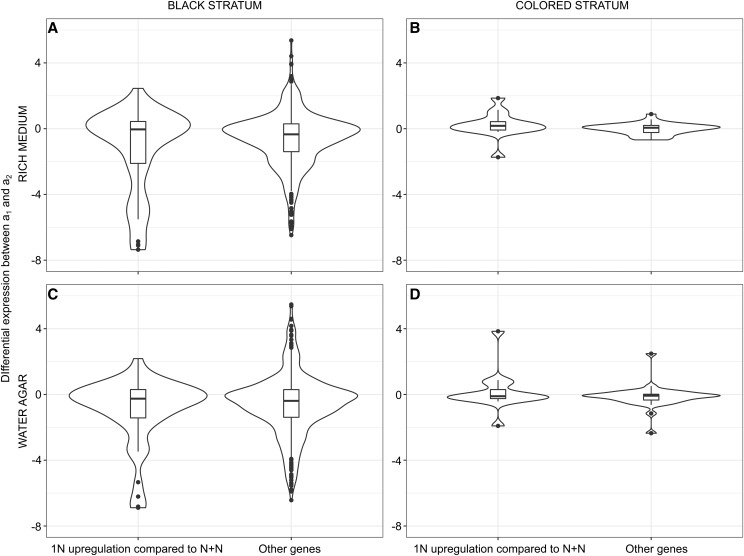
Figure 5.
Strength of differential expression between mating-types in Microbotryum lychnidis-dioicae. Violin plot of differential expression (beta values, calculated in a similar way as the usual log2 fold-change) between the a1 and a2 mating types at haploid stages in Microbotryum lychnidis-dioicae, for genes found upregulated in at least one haploid stage compared to the dikaryotic stage and for the other genes (either upregulated in the dikaryon or without differential expression), in the black stratum (A and C) or the color strata (B and D), on rich medium (A and B) or water (C and D).

