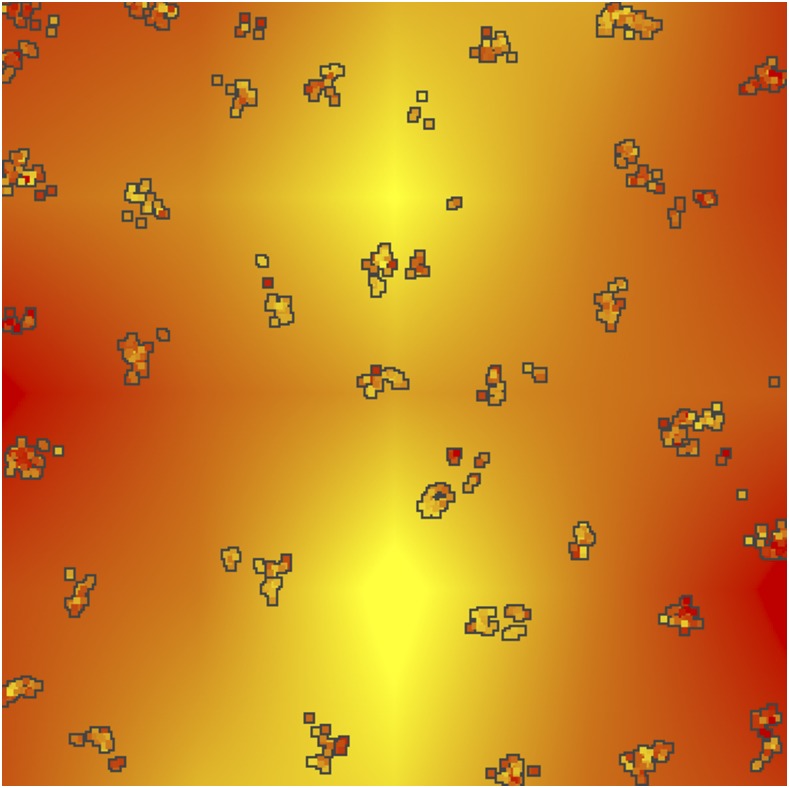
Figure 1.
Example landscape simulation. Each box is an individual, colored by their phenotypic value. The background is the selective environment. This output was generated after 1900 generations of selection by the environment, resulting in a correlation of 0.52 between the phenotype and the environment.

